Figure 7.
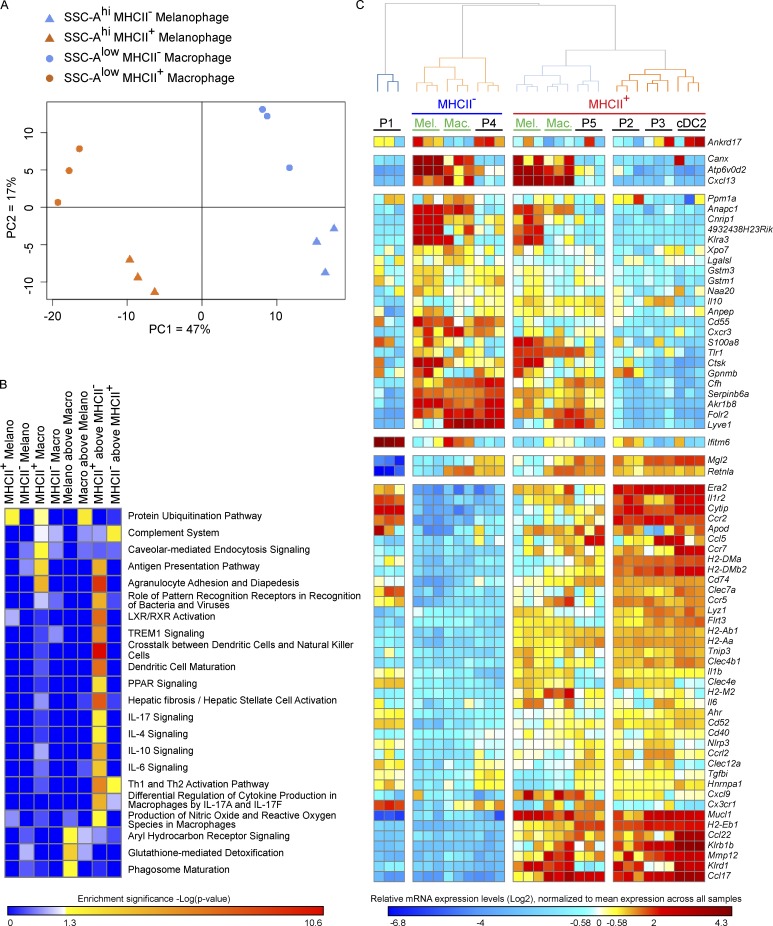
Gene expression profiling of MHCII+ and MHCII– melanophages and macrophages from steady-state dermis. MHCII+ and MHCII– CD64+CCR2–SSC-Alow macrophages and MHCII+ and MHCII– CD64+SSC-Ahigh melanophages were sorted in triplicates from ear skin and subjected to gene-expression profiling (Affymetrix 1.0ST). (A) PCA of gene expression by MHCII+ and MHCII– dermal macrophages and MHCII+ and MHCII– melanophages, based on all the 1,054 unique genes differentially expressed between at least one pair of experimental conditions. The percentage of overall variability of the dataset is indicated along each PC axis. (B) Heat map representation of selected functions and pathways found enriched by IPA for the lists of genes differentially expressed in one of the three cell types, between MHCII+ versus MHCII− cells, or between melanophages and macrophages. (C) Heat map showing the expression pattern across skin monocytes (P1), mo-DCs (P2, P3), macrophages (P4, P5, Mac), melanophages (Mel), and cDC2s of selected genes contributing to IPA enrichments for the SSC-Alow macrophage, SSC-Ahi melanophage, and MHCII– versus MHCII+ transcriptomic signatures. The cell samples which names are in black font on the top of the heat map originate from Tamoutounour et al. (2013), where the P4 and P5 cells correspond to the MHCII– and MHCII+ macrophages from the present study. The exhaustive lists of genes responsible for the IPA enrichments shown in B are provided in Table S1.

