Figure 4.
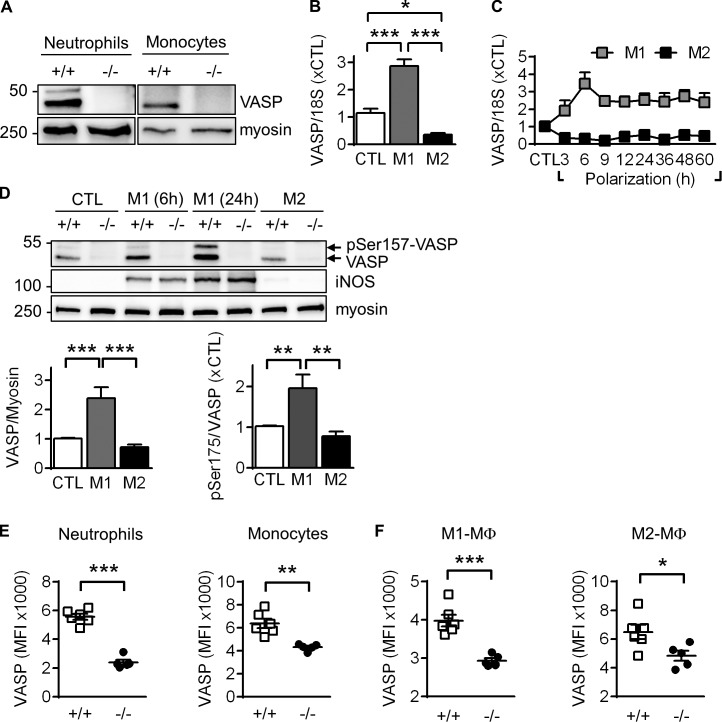
VASP expression in mouse leukocytes and polarized macrophages. (A) Western blots of VASP expression in BM-derived neutrophils and monocytes isolated by FACS from WT (+/+) and VASP−/− (−/−) mice. Myosin served as loading control. One representative experiment of a series of four is shown. (B) VASP mRNA levels in mouse BM–derived CTL macrophages, as well as after M1 (10 ng/ml LPS and 1 ng/ml IFNγ, 24 h) or M2 (25 ng/ml IL-4, 24 h) stimulation; n = 9 animals per group. (C) Time course of changes in VASP mRNA levels after M1 or M2 polarization; n = 4 animals per group. (D) Effect of macrophage polarization (6 or 24 h) on VASP protein levels and phosphorylation. iNOS expression is shown as a control for M1 polarization. (E and F) FACS analysis of VASP protein levels in leukocytes infiltrated into the hindlimb 3 d after femoral artery excision. n = 5–8 animals per group; error bars, SEM; *, P < 0.05; **, P < 0.01; ***, P < 0.001 (Student’s t test).

