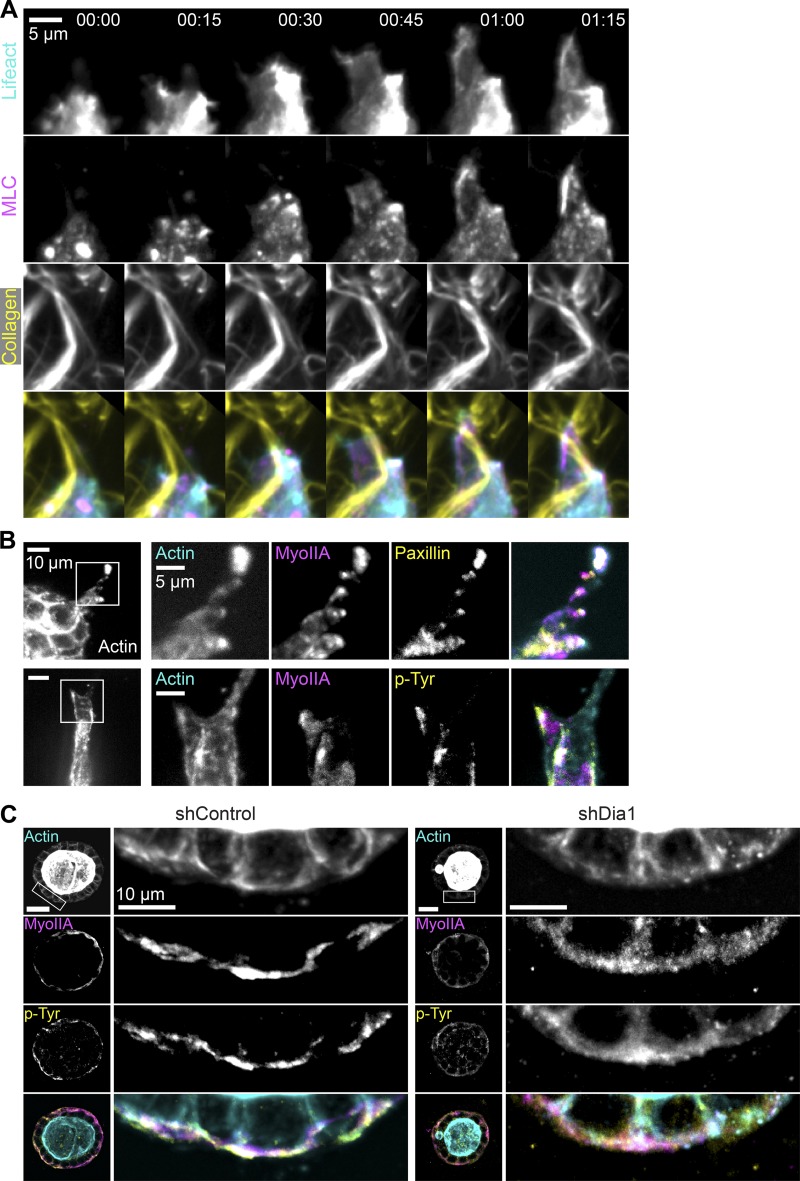
Figure 7.
Myosin colocalizes with Dia1-dependent focal adhesions. (A) Time-lapse images of a leader cell protruding into the surrounding collagen matrix from an shControl acinus stimulated with HGF for 24 h. Images of GFP-LifeAct (cyan), mCherry-MLC (magenta), and Alexa Fluor 647–labeled collagen (yellow) are shown. Time is indicated in h:min. See also Video 8. (B) Immunofluorescence images of actin (cyan), myosin IIA (magenta), and phosphotyrosine (p-Tyr; top) or paxillin (bottom) shown in yellow in leader cells extending from shControl acini after stimulation with HGF for 48 h. (C) Immunofluorescence images of actin (cyan), myosin IIA (magenta), and phosphotyrosine acini 4 h after stimulation with HGF combined into maximum-intensity projections spanning 3 µm. Insets of the indicated boxed regions are shown at right.

