Figure 8.
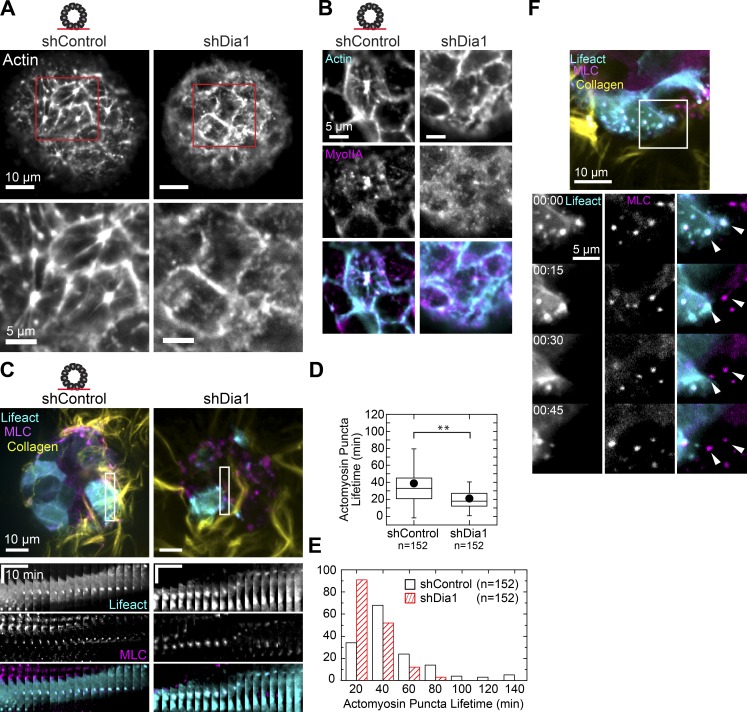
Dia1 regulates actomyosin organization and dynamics of the basal cortex. (A) Actin stain of the basal surface of acini before HGF addition with regions of interest enlarged below. (B) Immunofluorescence of the basal surface of actin (cyan) and myosin IIA (magenta) in shControl and shDia1 acini stimulated with 20 ng/ml HGF for 4 h. (C) shControl and shDia1 acini expressing GFP-LifeAct (cyan) and mCherry-MLC (magenta) were stimulated for 4 h with HGF, and fluorescence images were taken every 3 min at the basal surface. Kymographs show representative MLC and actin puncta, time scale bar represents 10 min, and distance scale is 10 µm. See also Video 9. (D) Box plot of actomyosin puncta lifetimes per field of view observed over a 3-h window in n = 16 acini of each type. **, P < 0.01 by a Student’s two-tailed t test assuming unequal variance. (E) Histogram showing the distribution of actomyosin puncta lifetimes. (F) Fluorescence images of GFP-LifeAct– (cyan), mCherry-MLC– (magenta), and Alexa Fluor 647–labeled collagen (yellow) in an shControl acinus. Montage shows the movement of a cell with high expression of GFP-LifeAct followed by a low-expressing cell. As the first cell moves to the left, MLC and LifeAct puncta remain stationary. Once the cell moves past this region, the next cell forms puncta at the same points (arrowheads). See also Video 10. Box plot shows the 25th and 75th percentiles and the median, circles indicate means, and whiskers mark 1.5 SDs.

