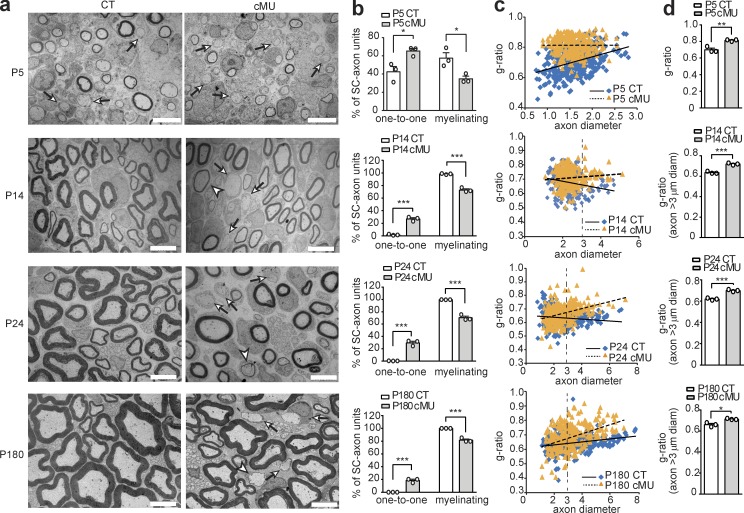
Figure 2.
De novo FA synthesis in nerve SCs is essential to achieve proper PNS myelination. (a) Representative EM images of mutant (cMU) and control (CT) sciatic nerve cross sections. Whereas in CT nerves individual large-caliber axons are sorted by SCs to the promyelinating stage (examples indicated by arrows) and progressively myelinated, many SCs remain blocked at promyelination in cMU (examples indicated by arrows). cMU nerves also display more thinly myelinated axons (examples indicated by arrowheads). Bars, 5 µm. (b) Corresponding graphs with quantification of percentage of SC-axon units at the one-to-one versus myelinating stage. Data points represent n = 3 mice for each, CT and cMU, with at least 250 sorted axons quantified in one nerve per animal (unpaired two-tailed two sample Student’s t test, P5 cMU vs. CT, P = 0.0249, t = 3.50; P14 cMU vs. CT, P = 0.0002, t = 12.65; P24 cMU vs. CT, P = 0.0004, t = 11.29; and P180 cMU vs. CT, P = 0.0006, t = 9.859); *, P < 0.05; ***, P < 0.001. (c) Linear correlation of g-ratio versus axon diameter in sciatic nerves of cMU compared with CT. At least 80 myelinated axons per mouse analyzed, three mice for each, CT and cMU. (d) Overall hypomyelination at P5 and of grouped larger (≥3 µm in diameter) axons at later stages (P14, P24, and P180) in cMU, as shown by g-ratio analysis. Data points represent n = 3 mice for each, CT and cMU (unpaired two-tailed two sample Student’s t test, P5 P = 0.0058, t = 5.376; P14 P = 0.0007, t = 9.449; P24 P = 0.0006, t = 9.798; and P180 P = 0.0114, t = 4.438); *, P < 0.05; **, P < 0.01; ***, P < 0.001. Bars represent mean ± SEM.

