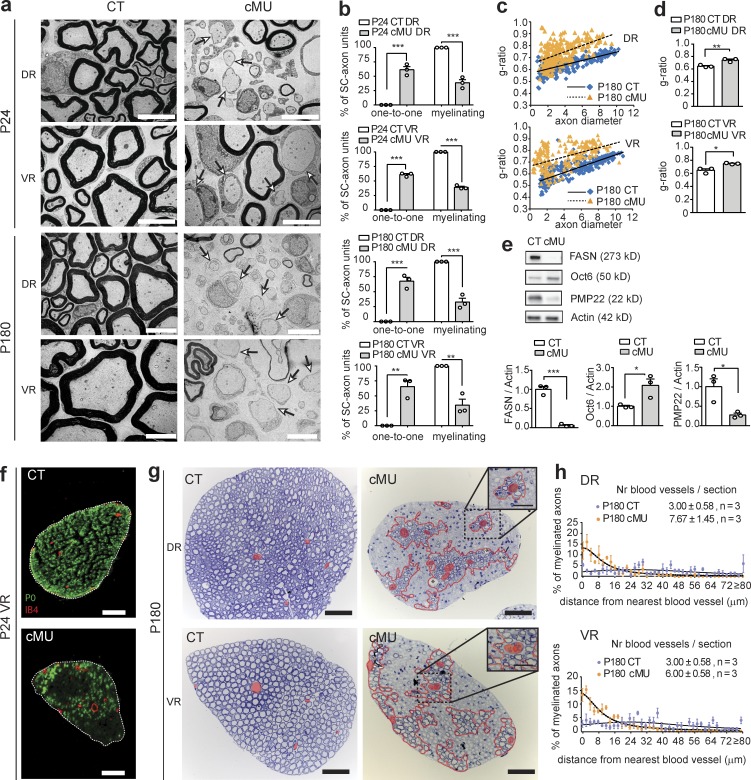
Figure 3.
SCs in nerve roots are strongly dependent on de novo FA synthesis. (a) Exemplary EM images of lumbar dorsal root (DR) and ventral root (VR) cross sections from mutant (cMU) and (CT) mice. In cMU roots, many SC-axon units remain blocked at the promyelinating stage (examples indicated by arrows). Bars, 5 µm. (b) Corresponding graphs depicting complete quantification on fully reconstructed, EM-recorded root cross sections of the percentage of SC-axon units at the one-to-one versus myelinating stage. Data points represent n = 3 mice for each, CT and cMU (unpaired two-tailed two sample Student’s t test, P24 DR cMU vs. CT P = 0.0004, t = 11.10; P24 VR cMU vs. CT P < 0.0001, t = 32.94; P180 DR cMU vs. CT P = 0.0005, t = 10.39; and P180 VR cMU vs. CT P = 0.0026, t = 6.694); **, P < 0.01; ***, P < 0.001. (c) Correlation of g-ratio versus axon diameter. Graphs show values obtained from at least 40 myelinated axons per root per mouse; n = 3 mice for each, CT and cMU. (d) Hypomyelination shown by g-ratio analysis. Data points represent n = 3 mice for each, CT and cMU (unpaired two-tailed two sample Student’s t test, P180 DR P = 0.0093, t = 4.704; P180 VR P = 0.0132, t = 4.243); **, P < 0.01; *, P < 0.05. (e) Immunoblots normalized to β-actin and corresponding graphs. n = 3 blots, each data point representing an independent experiment with an independent set of lysates from pooled DRs and VRs from three CT and three cMU mice (unpaired two-tailed two sample Student’s t test, FASN, P = 0.0003, t = 12.04; Oct6, P = 0.0328, t = 3.204; PMP22, P = 0.0250, t = 3.496); *, P < 0.05; ***, P < 0.001. (f) Representative immunohistochemistry of VRs of P24 CT and cMU showing myelinating SCs expressing myelin Protein Zero (P0). In cMU, myelinating axons are enriched in proximity to IB4-positive blood vessels. Bars, 50 µm. n = 3 mice for each, CT and cMU. (g) Representative toluidine-blue stained semithin cross sections of DRs and VRs (P180). In cMU, the areas covered by myelinated axons (red dotted line) are stereotypically positioned around blood vessels (false-colored in red). Bars, 50 µm; (insets) 25 µm. n = 3 mice for each, CT and cMU. (h) Graphs with relative distribution of myelinated axons, categorized by their distance from the closest blood vessel, in DRs and VRs (P180), CT and cMU. n = 3 mice for each, CT and cMU. Number (Nr) of blood vessels per toluidine blue–stained nerve cross section; mean ± SEM; n = 3 mice for each, CT and cMU (unpaired two-tailed two sample Student’s t test, DR, P = 0.0405, t = 2.985; VR, P = 0.0213, t = 3.674). Bars represent mean ± SEM.

