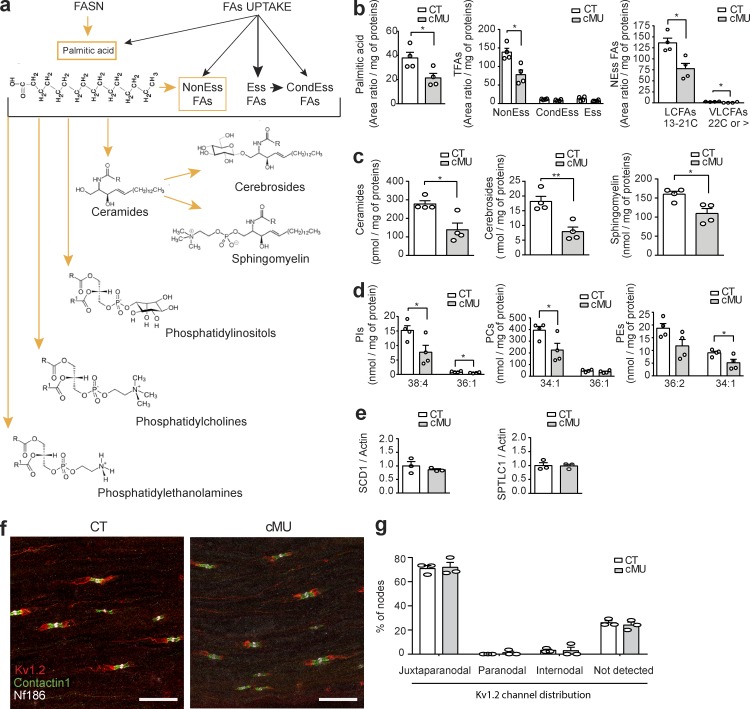
Figure 5.
De novo FA synthesis in SCs is crucial for correct lipid composition of peripheral nerves. (a) Proposed hypothetical schema of sources of FAs and derived lipids in nerves. Proper nerve pools of nonessential (NonEss) FAs and derived complex lipids rely on endogenous FA synthesis in SCs (highlighted in orange), in contrast to essential (Ess) FAs, taken up through the diet, and conditional essential (CondEss) FAs, taken up through the diet or synthesized from essential FAs. (b) Reduction in palmitic acid and nonessential FAs (NEss), both long-chain (LCFAs) and very-long-chain (VLCFAs), in nerves of P24 mutant (cMU) mice compared with controls (CT; unpaired two-tailed two sample Student’s t test, palmitic acid P = 0.0313, t = 2.796; NEss FAs P = 0.0106, t = 3.655; CondEss FAs P = 0.0640, t = 2.266; Ess FAs P = 0.1292, t = 1.758; LCFAs P = 0.0114, t = 3.597, VLCFAs P = 0.0208, t = 3.111); *, P < 0.05. (c) Content of ceramides, cerebrosides, and sphingomyelin in nerves of P24 mutant (cMU) mice compared with controls (CT; unpaired two-tailed two sample Student’s t test, ceramides P = 0.0133, t = 3.471; cerebrosides P = 0.0045, t = 4.417; sphingomyelin P = 0.0157, t = 3.334); *, P < 0.05; **, P < 0.01. (d) Quantification of the two most abundant species of phosphatidylinositols (PIs), phosphatidylcholines (PCs), and phosphatidylethanolamines (PEs) in nerves of P24 cMU compared with CT (unpaired two-tailed two sample Student’s t test, PI 38:4 P = 0.0416, t = 2.583; PI 36:1 P = 0.0355, t = 2.701; PC 34:1 P = 0.0419, t = 2.577; PC 36:1 P = 0.2728, t = 1.207; PE 36:2 P = 0.0702, t = 2.199; PE 34:1 P = 0.0414, t = 2.587); *, P < 0.05. Data points represent n = 4 mice for each, CT and cMU, in entire lipidomic analysis. Lipid amounts normalized to the total protein contents of the sample (two pooled nerves per mouse). (e) Graphs of qRT-PCR analysis of SCD1 and SPTLC1 in sciatic nerves of P40 CT and cMU mice. qRT-PCR data normalized to β-actin, data points represent n = 3 mice for each, CT and cMU mice (unpaired two-tailed two sample Student’s t test, SCD1 P = 0.4292, t = 0.8786; SPTLC1 P = 0.9143, t = 0.1146). (f) Representative z-projections of stacks imaged by confocal microscopy of immunostaining of the juxtaparanodal potassium channel Kv1.2, the paranodal contactin 1, and the nodal neurofascin 186 proteins, in longitudinal sections of sciatic nerves from P30 CT and cMU mice, n = 3 mice for each, CT and cMU. Bar, 20 µm. (g) Graph showing quantification of Kv1.2 potassium channel localization, as the percentage of nodes with expression restricted to the juxtaparanode (juxtaparanodal), or aberrantly present in the paranode (paranodal), diffuse in the internode (internodal), or not detected. The graph represents values obtained from at least 40 nodes per mouse, from three mice for each, CT and cMU (two-way ANOVA, genotype P = 0.3739; F1,4 = 1, localization P < 0.0001; F3,12 = 312.6, with Sidak’s multiple comparisons test, cMU vs. CT juxtaparanodal P = 0.9966, t = 0.312; cMU vs. CT paranodal P = 0.9939, t = 0.3638; cMU vs. CT internodal P > 0.9999, t = 0.0539; cMU vs. CT not detected P = 0.9565, t = 0.6209). Bars represent mean ± SEM.

