Figure 6.
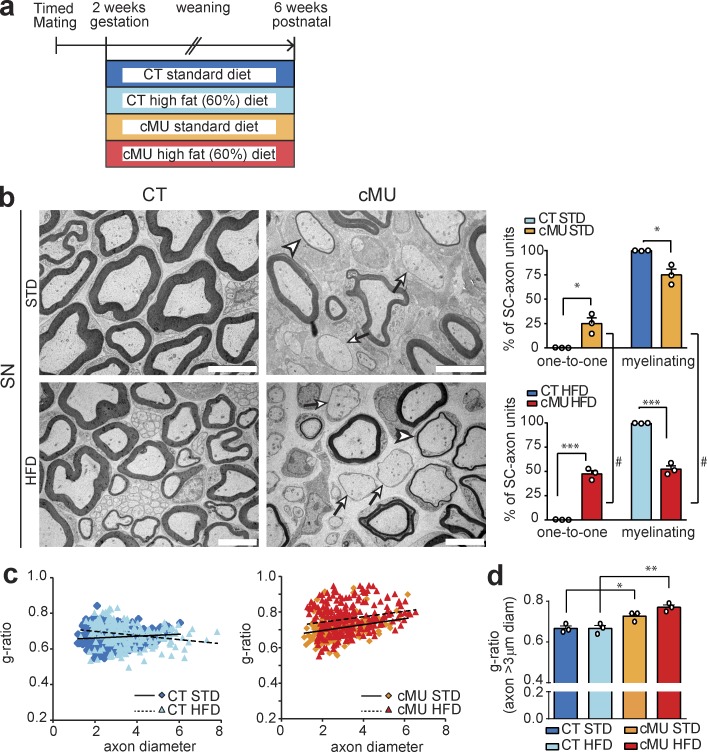
Increased lipid dietary intake did not substitute for SC endogenous FA synthesis. (a) Schema depicting the experimental design. (b) Exemplary EM micrographs of sciatic nerve cross sections from mutant (cMU) and control (CT) mice fed an STD or HFD, and graphs of the percentage of one-to-one versus myelinating SC-axon units. Sciatic nerves (SNs) from cMU mice fed a standard or HFD showed SCs blocked at the promyelinating stage (examples indicated by arrows) and hypomyelinated axons (examples indicated by arrowheads). Bars, 5 µm. Data points represent n = 3 mice for each, CT and cMU, and for each, STD and HFD (unpaired two-tailed two sample Student’s t test, STD cMU vs. CT, P = 0.0133, t = 4.240; HFD cMU vs. CT, P = 0.0002, t = 13.98; cMU HFD vs. STD, P = 0.0290, t = 3.334); #, P < 0.05; *, P < 0.05; ***, P < 0.001. #, Significance of high-fat compared with STD. *, Significance of cMU compared with CT. (c) Linear correlation of g-ratio versus axon diameter. The graph represents values obtained from at least 50 myelinated axons per mouse, from three mice for each, CT and cMU. (d) g-ratio analysis of larger (≥3 µm in diameter) axons shows no detectable amelioration of sciatic nerve hypomyelination of cMU mice fed an HFD. Data points represent n = 3 mice for each, CT and cMU, and for each, standard and HFD (one-way ANOVA, treatment P = 0.0011, F3,8 = 15.22, with Sidak’s multiple comparisons test; cMU STD vs. CT STD P = 0.0436, t = 3.286; cMU HFD vs. CT HFD P = 0.0019, t = 5.660; CT HFD vs. CT STD P > 0.9999, t = 0.0; cMU HFD vs. cMU STD P = 0.1682, t = 2.373); *, P < 0.05; **, P < 0.01. Bars represent mean ± SEM.

