Figure 7.
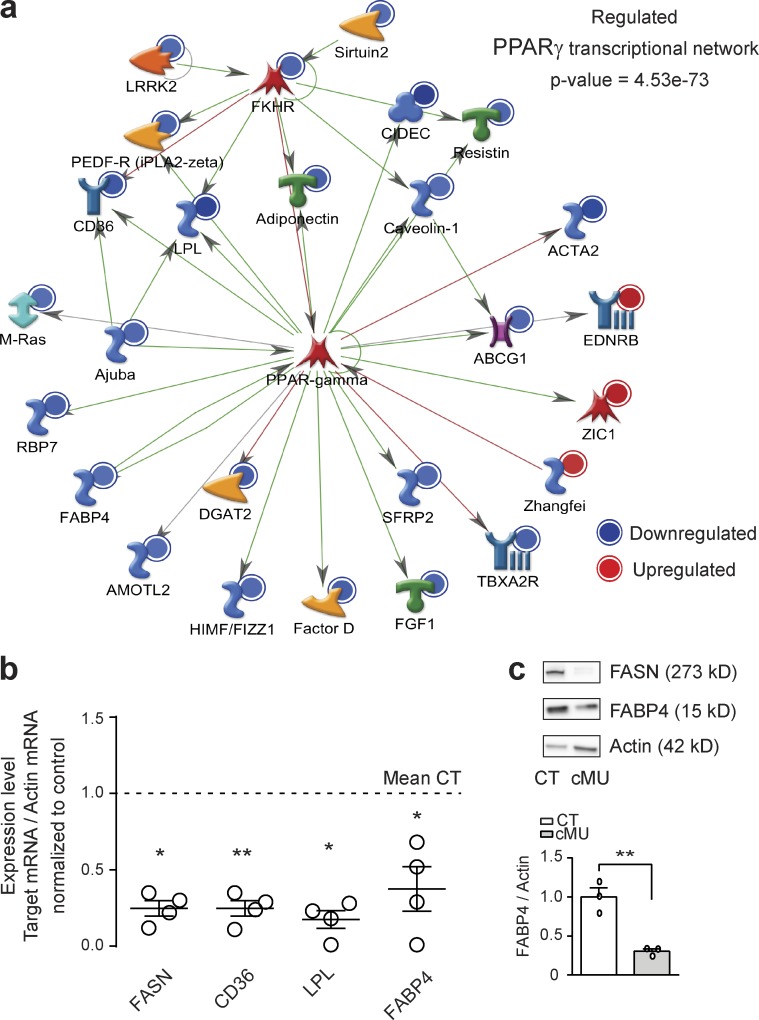
FA synthesis in SCs triggers the activation of the PPARγ transcriptional program. (a) MetaCore analysis including all identified regulated transcripts (ANOVA with Benjamini-Hochberg false discovery rate for multiple testing correction, P < 0.05, ≥1.5-fold change) in sciatic nerves of mutant (cMU) mice compared with controls (CT) revealed inhibition of the PPARγ transcriptional network (schema as exported from Metacore version 6.29). Color intensity indicates degree of regulation. Symbols refer to protein category classes according to Metacore version 6.29 classification (https://download.genego.com/files/A4_MetaCore_qrg_en.pdf). (b) Graph of qRT-PCR analysis of FASN, CD36, LPL, and FABP4 in nerves of P60 CT and cMU mice. Data normalized to β-actin and to the mean of CT. Data points represent n = 3 mice for CT and n = 4 mice for cMU (unpaired two-tailed two sample Student’s t test, FASN, P = 0.0203, t = 3.350; CD36, P = 0.0023, t = 5.711; LPL, P = 0.0123, t = 3.823; FABP4, P = 0.0161, t = 3.567); *, P < 0.05; **, P < 0.01. (c) Immunoblotting and corresponding graph showing decreased expression of FABP4 in lysates of sciatic nerves from P40 cMU compared with CT mice. Immunoblots normalized to β-actin. n = 3 blots, each data point representing an independent experiment with an independent set of lysates from three CT and three cMU mice (unpaired two-tailed two sample Student’s t test, P = 0.0045, t = 5.764); **, P < 0.01. Bars represent mean ± SEM.

