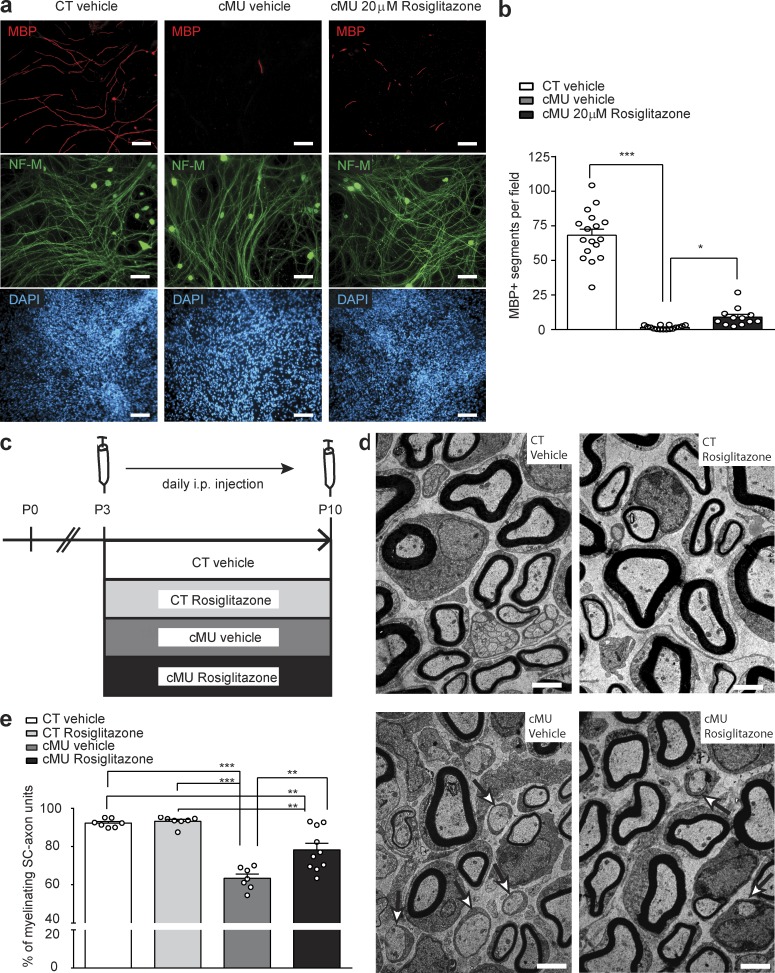
Figure 8.
Rosiglitazone administration partially rescues dysmyelination of FASN mutant SCs. (a) Exemplary immunofluorescence of myelinating dissociated DR ganglia. Vehicle-treated control (CT), vehicle-treated mutant (cMU), and rosiglitazone-treated (20 µM) cMU mice. Treatment was started on the day when ascorbic acid was added. Bars, 100 µm. (b) Quantification of MBP-positive segments, 9 d after induction of myelination in CT and cMU treated cultures. Quantification was performed on four or more randomly selected fields of view per coverslip, on three to eight coverslips for each condition per experiment, in three independent experiments. Data points represent n = 17 coverslips of cultures from CTs treated with vehicle, n = 16 coverslips of cultures from cMUs treated with vehicle, and n = 12 coverslips of cultures from cMUs treated with rosiglitazone (Kruskal-Wallis, P < 0.0001, H = 37.78, with Dunn’s multiple comparison test; cMU vehicle vs. CT vehicle P < 0.0001; cMU rosiglitazone vs. cMU vehicle P = 0.0289); ***, P < 0.001; *, P < 0.05. (c) Schema depicting the experimental design of in vivo rosiglitazone or vehicle injections. (d) Exemplary electron micrographs of sciatic nerve cross sections of vehicle- or rosiglitazone-injected CT and cMU mice. Examples of promyelinating SC-axon units indicated by arrows. Bars, 2 µm. (e) Corresponding graph depicting complete quantification on fully reconstructed, EM-recorded cross sections of the percentage of myelinated axons (among sorted SC-axon units). Data points represent n = 7 mice each, for vehicle-injected CT, rosiglitazone-injected CT, and vehicle-injected cMU mice, and n = 10 mice for rosiglitazone-injected cMU mice (one-way ANOVA, treatment P < 0.0001, F3,27 = 27.65, with Tukey’s multiple comparisons test; cMU vehicle vs. CT vehicle P < 0.0001; cMU rosiglitazone vs. CT vehicle P = 0.0023; CT rosiglitazone vs. CT vehicle P = 0.9946; cMU vehicle vs. CT rosiglitazone P < 0.0001; cMU rosiglitazone vs. cMU vehicle P = 0.0012; cMU rosiglitazone vs. CT rosiglitazone P = 0.0011); **, P < 0.01; ***, P < 0.001. Bars represent mean ± SEM.

