Figure 2.
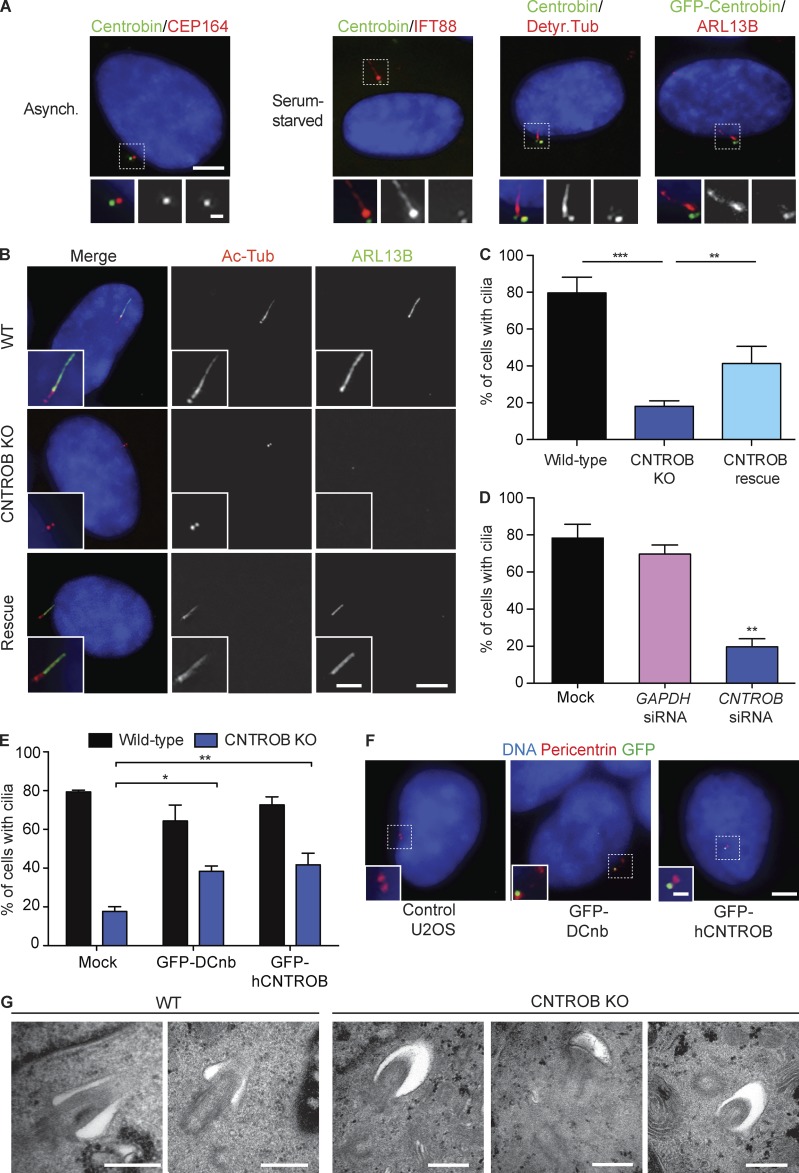
CNTROB null cells are defective in primary ciliogenesis. (A) Localization of centrobin (green) in asynchronous (Asynch.) or 48-h serum-starved cells. Detyr. Tub, detyrosinated tubulin. Bars: 5 µm; (inset) 1 µm. (B) IF microscopy of the cilium markers ARL13B (green) and acetylated tubulin (red) in cells after 48-h serum starvation. Bars: 5 µm; (inset) 2 µm. (C) Quantitation of the ciliation frequency after 48-h serum starvation showing mean + SEM of three independent experiments in which at least 100 cells were quantitated by acetylated tubulin staining. **, P < 0.01; ***, P < 0.001, in comparison to indicated samples by unpaired t test. (D) siRNA knockdown of CNTROB was used to ablate centrobin, with a GAPDH siRNA used as negative control (siGAPDH). Bar chart shows quantitation of the ciliation frequency after 24 h serum starvation. (E) Quantitation of the ciliation frequency after 48-h serum starvation of cells transiently transfected with GFP-tagged centrobin constructs. Bar charts show mean + SEM of three independent experiments in which at least 100 cells were quantitated by ARL13B staining. *, P < 0.05; **, P < 0.01, in comparison to controls by unpaired t test. (F) IF microscopy of U2OS cells transiently transfected with GFP-tagged human or Drosophila centrobin (green) with pericentrin (red) as a marker for centrosomes. Bars: 5 µm; (inset) 1 µm. (G) Transmission electron microscopy analysis of WT and centrobin null (knockout [KO]) cells after 48-h serum starvation. Bars, 500 nm.

