Figure 1.
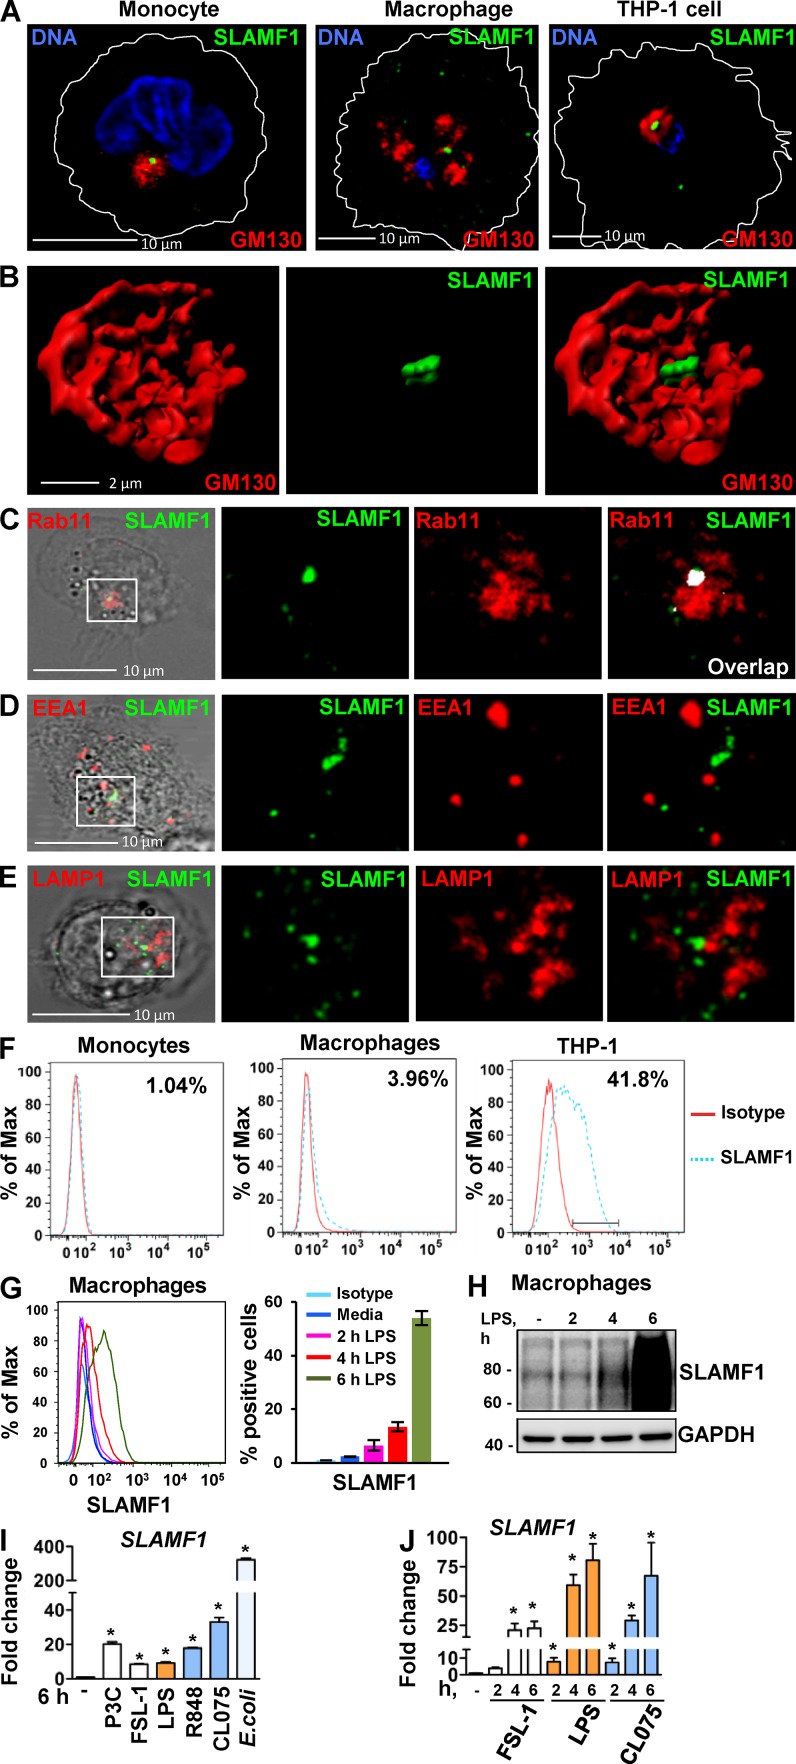
SLAMF1 is enriched in the Rab11-positive ERCs in unstimulated macrophages, and SLAMF1 expression is induced by LPS and several other TLR ligands in primary human monocytes and macrophages. (A) Monocytes, macrophages, and differentiated THP-1 cells stained with antibodies against SLAMF1 (green) and GM130 (red) and imaged by confocal microscopy. (B) 3D model of cis-Golgi (GM130) and SLAMF1 in THP-1 cells. Z stacks from the GM130 and SLAMF1 channels were obtained using high-resolution confocal microscopy followed by 3D modeling in IMARIS software. (C) Macrophages stained for SLAMF1 and Rab11 (ERC marker). Representative image. Overlapping pixels for SLAMF1 and Rab11 are shown in the white overlap. tM1 = 0.683 ± 0.08 (mean with SD) for z stacks of ERCs as ROIs (30 ROIs analyzed per donor) where tM1 was the Manders’s colocalization coefficient with thresholds calculated in the Coloc 2 Fiji plugin with anti-SLAMF1 staining as first channel. (D) Macrophages costained for SLAMF1 and EEA1. (E) Macrophages costained for SLAMF1 and LAMP1. Colocalization accessed for z stacks for at least 30 cells for each experiment (four total) showing no colocalization for markers in both D and E. (F) Flow cytometry analysis of SLAMF1 surface expression by primary macrophages and differentiated THP-1 cells. Cells were costained for SLAMF1 and CD14 and gated for CD14-positive cells (primary cells) or stained for SLAMF1 (THP-1 cells). (G) Flow cytometry analysis of SLAMF1 surface expression by human macrophages stimulated by ultrapure K12 LPS (100 ng/ml) for 2, 4, and 6 h. (H) Western blot analysis of lysates from primary human macrophages stimulated by LPS for 2, 4, and 6 h. Graphs present mean values for three biological replicates with SD. Molecular weight is given in kilodaltons. (I and J) Quantification of SLAMF1 mRNA expression by qPCR in monocytes (I) and macrophages (J) stimulated by TLRs’ ligands FSL-1 (20 ng/ml), K12 LPS (100 ng/ml), and CL075 (1 μg/ml; both I and J) as well as R848 (1 μg/ml), Pam3Cys (P3C; 1 μg/ml), or K12 E. coli particles (20/cell; I only). Results are presented as means with SD. Statistical significance between groups was evaluated by a two-tailed t test. *, P < 0.01. Results are representative of at least four independent experiments/donors (A–H) or combined data for at least three donors (I and J).

