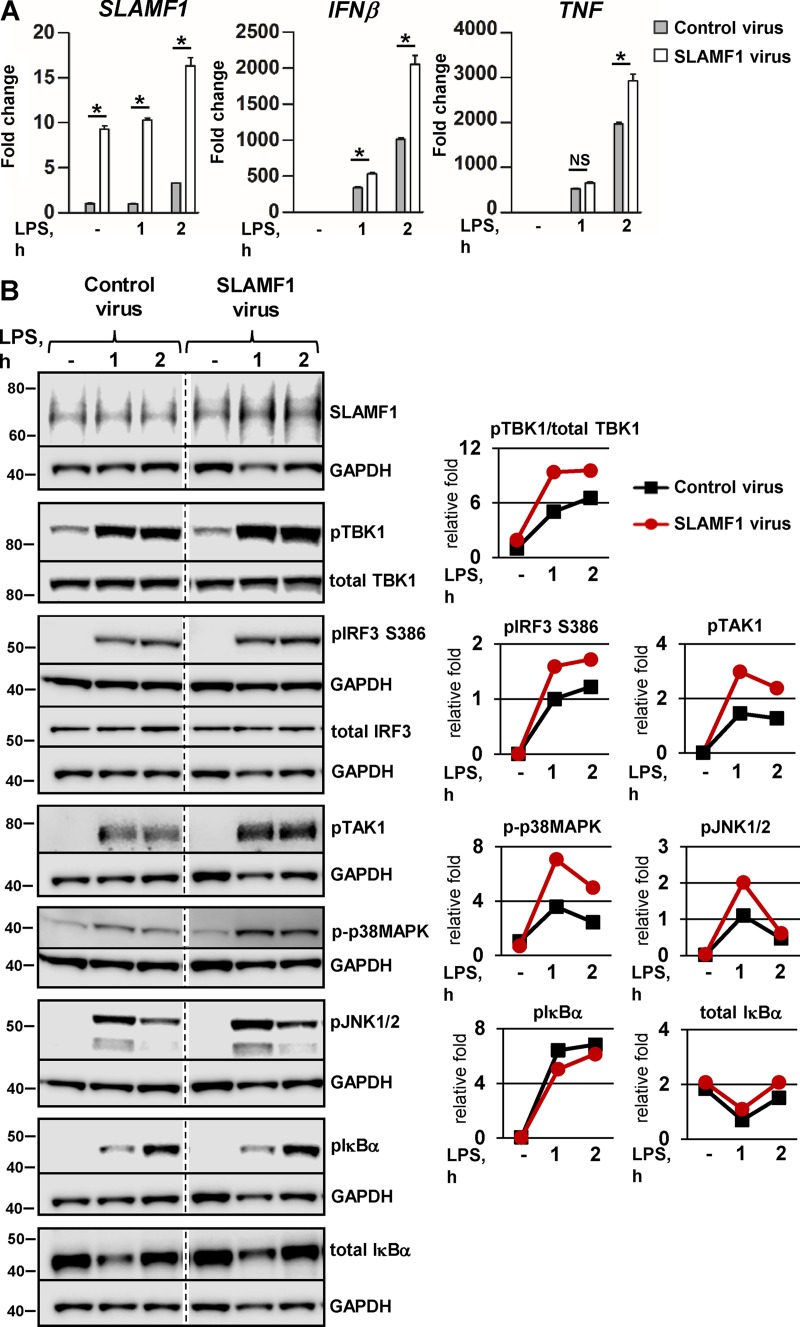
Figure 4.
Lentiviral transduction of SLAMF1 in macrophages results in the increase of IRF3 and TBK1 phosphorylation in response to LPS and upregulation of IFNβ and TNF expression. (A) Quantification of SLAMF1, IFNβ, and TNF mRNA expression by qPCR in macrophages transduced by Flag-tagged SLAMF1 coding or control virus and treated by LPS. The qPCR data are presented as means and SD for three biological replicates of one of three experiments. Significance was calculated by two-tailed t tests. *, P < 0.01. (B) Western blots showing LPS-induced phosphorylation of signaling molecules in cells transduced with the SLAMF1-expressing virus versus control virus. Dividing lines were added where the time point of 4 h was excised. The same GAPDH controls are presented for total IRF3 and total IκBα and for pIκBα and pTAK1 because they were probed on the same membranes. Molecular weight is given in kilodaltons. Graphs (right) show quantifications of protein levels relative to GAPDH levels obtained with Odyssey software.

