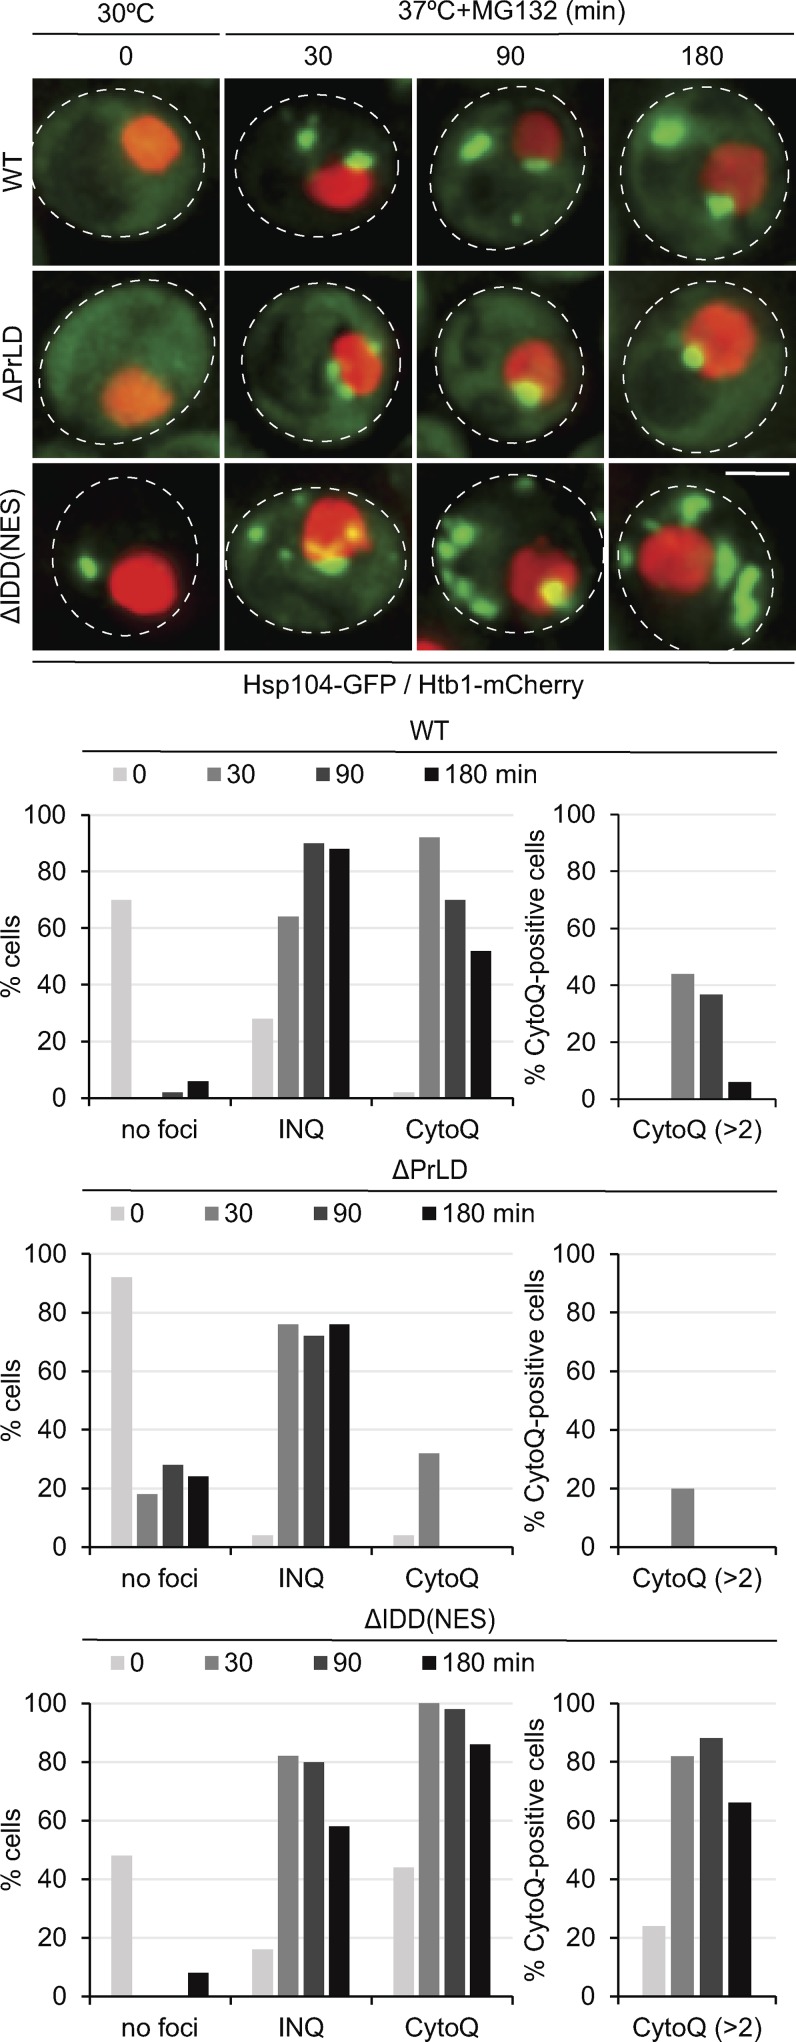
Figure 3.
Distinct functions of Hsp42 PrLD and IDD in CytoQ formation. Localization patterns of Hsp104-GFP and their superposition with the nuclear marker Htb1-mCherry in S. cerevisiae cells expressing Hsp42 WT or deletion mutants upon control conditions (30°C) and proteotoxic stress (37°C + MG132). The number of cells showing CytoQ (mCherry-VHL foci distant from the Htb1-cerulean signal) or INQ (mCherry-VHL foci adjacent or overlapping with the Htb1-cerulean signal) inclusions was quantified at the indicated time points (n > 50 cells). Maximal projections of widefield z stack images are presented. Bar, 2 µm.

