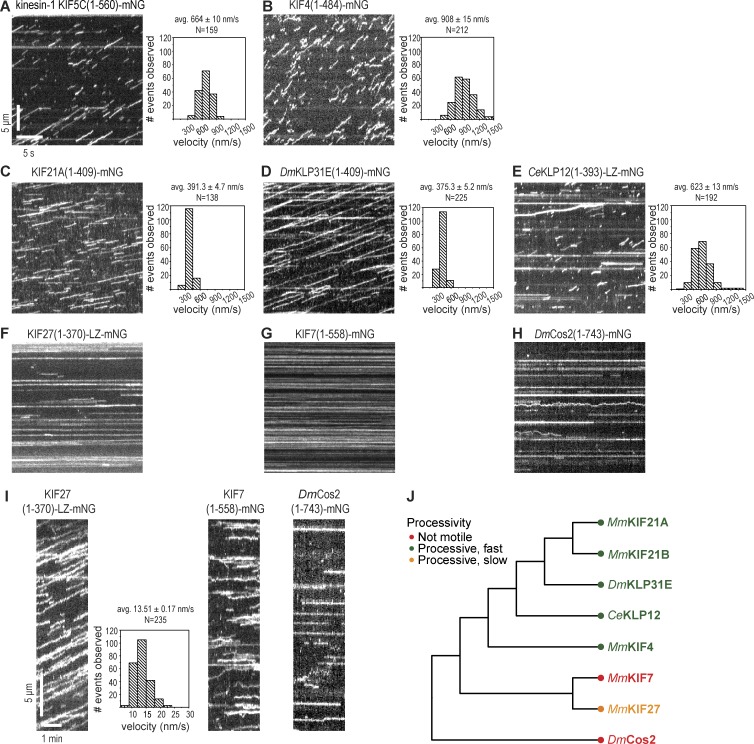
Figure 4.
Single molecule motility properties of kinesin-4 motors. (A–H) Representative kymographs showing single molecule motility of truncated versions of the kinesin-4 motors MmKIF4 (B), MmKIF21A (C), DmKLP31E (D), CeKLP12 (E), MmKIF27 (F), MmKIF7 (G), and DmCos2 (H) as compared with the kinesin-1 motor KIF5C (A). All motors were tagged with mNG at their C termini, and videos were acquired at a fast imaging rate (10 frames per second). Time is on the x axis (bar, 5 s), and distance is on the y axis (bar, 5 µm). Histograms of the velocities for each population of motors are plotted to the right of the kymographs. (I) Representative kymographs of single molecule motility of truncated versions of the kinesin-4 motors MmKIF27, MmKIF7, and DmCos2 imaged at a slow acquisition rate (1 frame/3 s). Time is on the x axis (bar, 1 min), and distance is on the y axis (bar, 5 µm). A histogram of the velocities for the population of KIF27 motors is shown to the right of the KIF27 kymograph. Motility data are described as means ± SEM. N, number of motility events analyzed across three independent experiments. (J) Motility of kinesin-4 motors based on the single molecule imaging results depicted on the phylogenetic tree.

