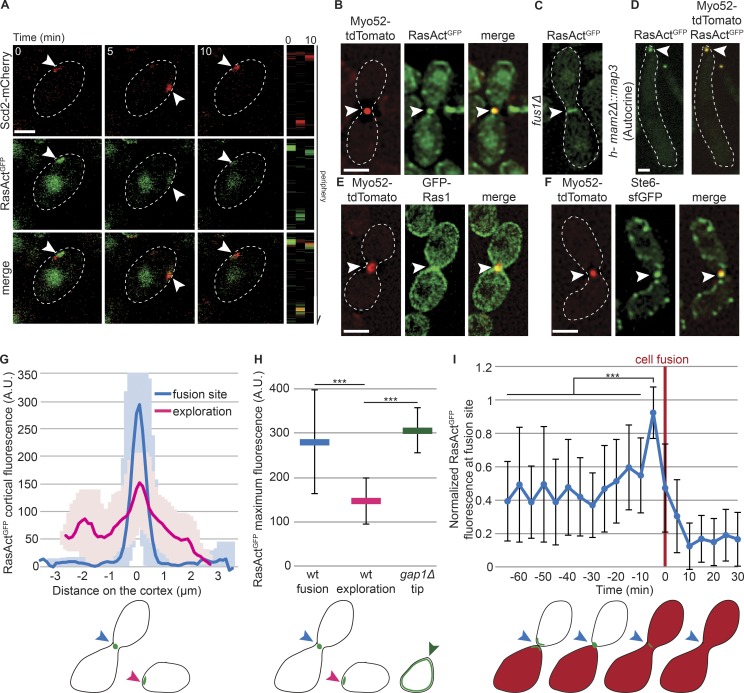
Figure 3.
Ras1 is active at polarity sites and the fusion focus. (A) h90 WT strains showing colocalization of Scd2-mCherry (red) and RasActGFP (green) during early mating. Right: Kymographs of the cell periphery. Arrowheads highlight dynamic zones of colocalization. (B) Colocalization of RasActGFP (green) and Myo52-tdTomato (red) at the fusion focus in h90 WT cells. (C) RasActGFP in fus1Δ cell pair. (D) Colocalization of RasActGFP (green) and Myo52-tdTomato (red) at the fusion focus in mam2Δ::map3 autocrine M-cells. (E) Broader localization of GFP-Ras1 (green) than Myo52-tdTomato (red) at the fusion site in h90 WT strains. (F) Colocalization of Ste6-sfGFP (green) and Myo52-tdTomato (red) at the fusion focus in h90 WT cells. (G) Cortical profiles of RasActGFP fluorescence in h90 WT strains during early (exploration; pink) or late (fusion site; blue) mating; n = 20. Thick line, mean; shaded area, SD. (H) Maximal RasActGFP cortical fluorescence in h90 WT cells during early (exploration; pink) or late (fusion; blue) mating and at the mating projections of h90 gap1Δ cells (green). Mean values of the five brightest pixels are shown; n = 20; ***, 9.7 × 10⁻³⁴ ≤ P ≤ 2.8 × 10⁻¹³. (I) Normalized value of RasActGFP cortical fluorescence over time at the fusion site in h90 WT cells. Fluorescence profiles were aligned to fusion time (t = 0) and normalized to maximal value; n = 22. ***, 8.7 × 10⁻¹² ≤ P ≤ 1.1 × 10⁻⁵. The schemes indicate where fluorescence was quantified. Error bars, SD. Bars, 2 µm.

