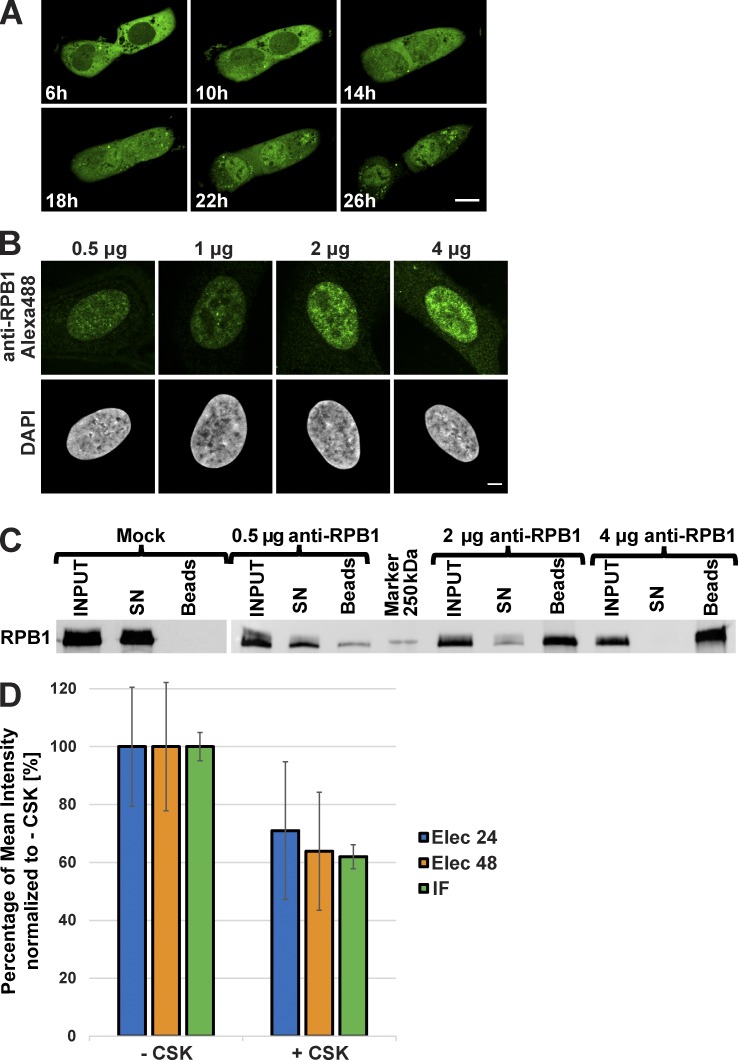
Figure 1.
Behavior of the anti-RPB1 mAb in U2OS cells. (A) After transduction with Alexa Fluor 488–labeled anti-RPB1 antibodies, cells were imaged after 6 h of incubation and then every hour over a period of 20 h (see Video 1 for all time points). Bar, 15 µm. (B) Increasing amounts of Alexa Fluor 488–labeled anti-RPB1 mAb were transduced in U2OS cells and fixed 24 h after electroporation. A typical nucleus recorded in each case after counterstaining with DAPI is shown. Bar, 5 µm. (C) Binding capacity of anti-RPB1 mAb in U2OS cells. Cells were electroporated with 0 (mock), 0.5, 2, and 4 µg anti-RPB1 mAb and whole-cell extracts prepared 24 h after transduction (INPUT) were mixed with protein G beads. Bound and unbound material was analyzed by Western blotting. The blot shows the fraction of antibody-bound Pol II molecules adsorbed on the beads (beads) or left in the supernatant (SN), and detected with a secondary antibody. (D) After transduction with Alexa Fluor 488–labeled anti-RPB1 mAb (2 µg), cells were treated with or without CSK buffer. The histogram shows the mean fluorescence intensity of the nucleus of nontreated (−CSK) and CSK-treated (+CSK) cells 24 h (Elec 24h) or 48 h (Elec 48h) after electroporation. A classical anti-RPB1 mAb IF experiment was performed as additional control (IF). The +CSK signal is represented as the percentage of the mean intensity of the −CSK signal. Error bars represent the SD obtained with 10 recorded cells for each condition. All images were acquired by confocal microscopy on one single z plane.

