Figure 2.
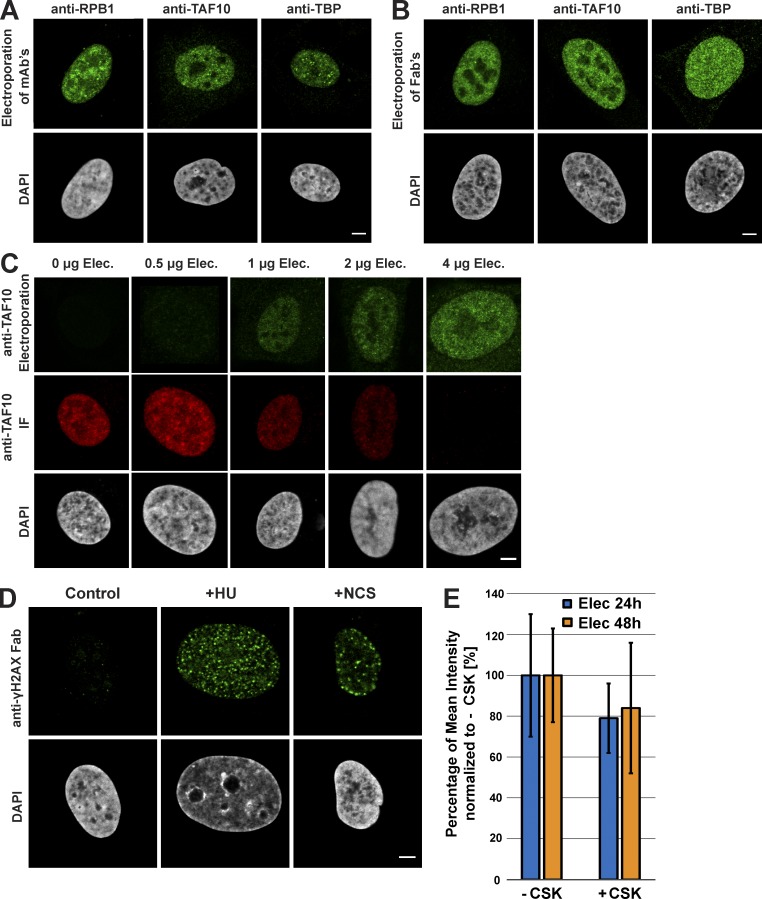
Visualization of endogenous transcription factors and phosphorylated H2AX with VANIMA. (A) The labeled mAbs binding specifically to the transcription factors RPB1, TAF10, and TBP were transduced in U2OS cells, and their localization in the cells was monitored by confocal microscopy 24 h after treatment. A single z plane is shown for each condition. The pictures represent a typical nucleus recorded in each case after fixation of the cells and subsequent counterstaining with DAPI. (B) Same as in A, except that the experiments were performed with the corresponding labeled Fab fragments. (C) Increasing amounts of Alexa Fluor 488–labeled anti-TAF10 mAb (green) were transduced in U2OS cells and fixed 24 h after electroporation (anti-TAF10 Electroporation). To verify binding of the antibody to TAF10, a competition assay was performed afterward by adding a constant amount (2 µg) of the same antibody but Alexa Fluor 568–labeled as IF antibody (red, anti-TAF10 IF; see also Fig. S1 C for quantification). DAPI staining is shown in gray. (D) The labeled Fab raised against γH2AX was transduced as in B, and its localization was recorded after treatment of the electroporated cells with either NCS (for 15 min) or HU (for 48 h). Control, nontreated cells. A typical nucleus is represented in each case. (E) After transduction with Alexa Fluor 488–labeled anti-γH2AX Fab (5 µg) and treatment with HU, cells were treated with or without CSK buffer before fixation. The histogram shows the mean fluorescence intensity of the nucleus of nontreated (−CSK) and CSK-treated (+CSK) cells 24 h (Elec 24h) or 48 h (Elec 48h) after electroporation. The +CSK signal is represented as the percentage of the mean intensity of the −CSK signal. Error bars represent the SD obtained with 10 recorded cells for each condition. Bars, 5 µm.

