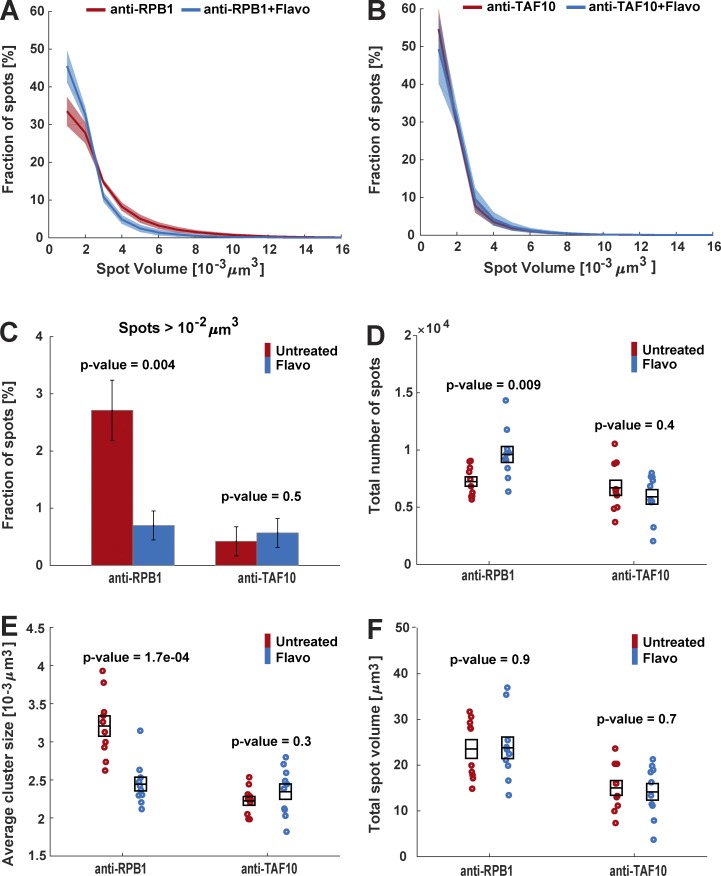
Figure 5.
Quantification of transcription factor distribution in single cells by using VANIMA and super-resolution microscopy. (A) U2OS cells were transduced with Alexa Fluor 488–labeled anti-RPB1 mAb and then treated with Flavo (2 µM) for 1 h or not (Untreated). 24 h after treatment the cells were fixed and analyzed by 3D-SIM. The number of individual spots and their volume in individual nuclei were quantified by using Fiji/ImageJ and Matlab software. The graph shows the percentage of spots with a given volume in untreated (red) and treated cells with Flavo (blue) acquired from 10 individual cells for each condition. (B) Same treatment and analysis as in A, but an Alexa Fluor 488–labeled anti-TAF10 antibody was transduced. (C) Spot volumes were extracted from A and B, and the percentage of spots of RPB1 and TAF10 with a volume >10−2 μm3 in the untreated (red) and Flavo (blue) treated cells is shown. The error bars represent the SE from 10 individual cells for each condition. (D) Total number of RPB1 and TAF10 spots in 10 individual nuclei for each condition are represented. (E) Mean cluster size of the RPB1 or TAF10 spots in 10 individual cells for each condition is shown. (F) Total spot volume of RPB1 and TAF10 in 10 individual nuclei for each condition is represented. All black boxes in D–F represent the means and their SEs for each sample. All p-values were calculated by using the two-sample t test.

