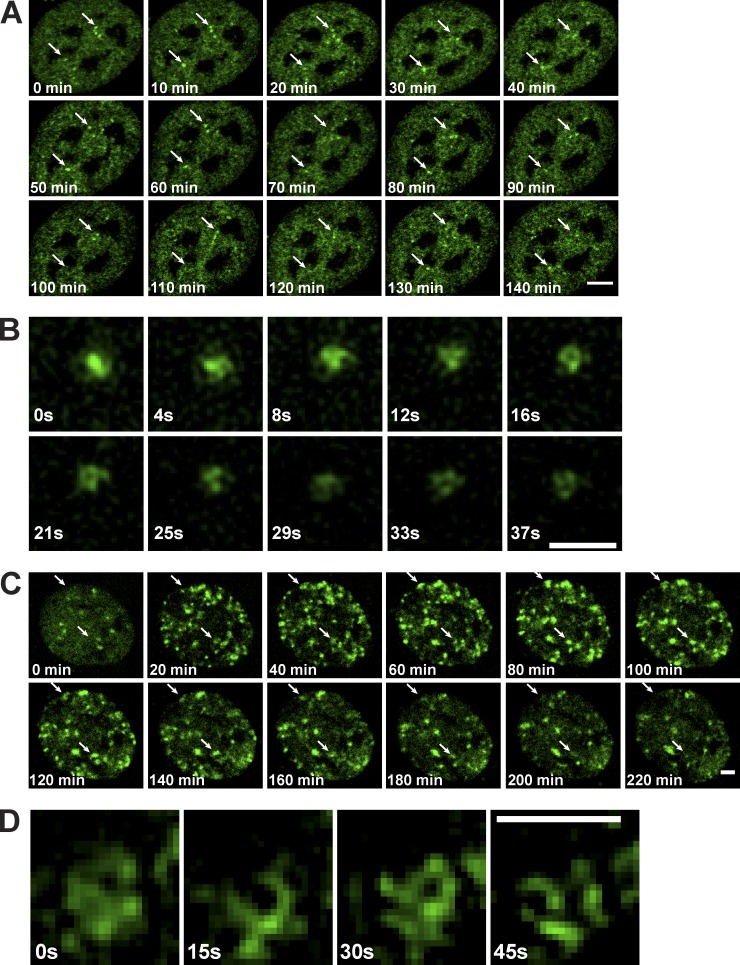
Figure 7.
Live imaging of transcription factors by using VANIMA. (A) 24 h after electroporation, U2OS cells transduced with Alexa Fluor 488–labeled anti-RPB1 mAb were subjected to live-cell analysis by confocal microscopy focusing on one z section of individual nuclei. They were imaged over a period of 2.5 h and pictures taken every 10 min (Video 7). Arrows point to two larger Pol II cluster examples that move over time. Bar, 5 µm. (B) Imaging by 3D-SIM microscopy of an individual Pol II cluster observed in U2OS after transduction as in A. The images were taken over a period of 37 s every 4.1 s and show a maximum intensity projection of the 3D video (Video 8). Bar, 1 µm. (C) U2OS cells transduced as in A with the labeled anti-γH2AX Fab were subjected to live-cell analysis by spinning-disk confocal microscopy after the addition of NCS to the culture medium. Pictures were taken every 10 min over a period of 4 h (Video 9) and by focusing on a single z plane. The first time point (0 min) corresponds to the time of the drug addition. Arrows point to γH2AX clusters that appear and disappear over time. Bar, 5 µm. (D) Imaging of an individual γH2AX cluster by 3D-SIM microscopy observed in U2OS cells after transduction as in C. Images were recorded over a period of 45 s every 15 s (Video 10). The first time point (0 s) shown was taken 10 min after NCS treatment. Bar, 0.8 µm.

