Figure 1.
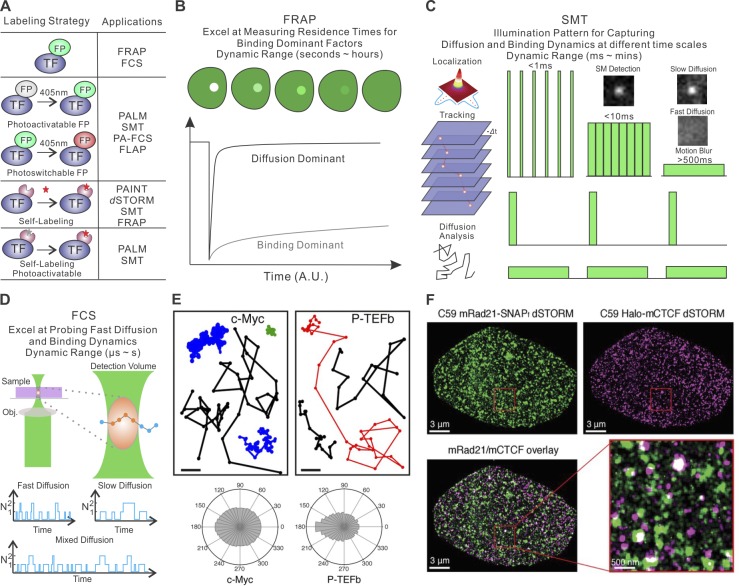
Methods for imaging TF dynamics and subnuclear structures in single cells. (A) Current TF labeling methods (left) and their suitable imaging applications (right). Specifically, three common strategies are schematized: (1) labeling with regular FPs, (2) labeling with photoactivatable/photoswitchable proteins, or (3) self-labeling tags such as HaloTag, SNAPTag, and TMPTag. Self-labeling tags can be conjugated with organic dyes for subsequent imaging applications. FLAP, fluorescence localization after photobleaching (Dunn et al., 2002); PAINT, points accumulation for imaging in nanoscale topography (Sharonov and Hochstrasser, 2006). (B) FRAP technique. A high-intensity–focused laser illumination pulse generates a bleached spot in the cell. The fluorescence recovery curve is the result of dissociation of bleached fluorescent molecules and diffusion-in of unbleached molecules. (C) SMT technique. Left: Sparsely labeled TF molecules appear to be diffraction-limited spots on the camera chip. The position of the TF molecule is determined by localization of the centroid of the spot by Gaussian fitting. The positions of one molecule across multiple frames are linked to form single-molecule trajectories. TF diffusion and binding dynamics can be extracted from single-molecule trajectories. Right: Distinct illumination patterns can be deployed to examine TF diffusion and binding dynamics at different time scales by limiting or using motion blur effect. Specifically, intensive stroboscopic illumination is an efficient way to reduce motion blurring for capturing fast diffusion events, whereas long acquisition times and low laser illumination are used for selectively imaging stable binding events. Long lapse times can also be introduced to reduce photobleaching and to specifically study long-lived binding events up to several minutes. (D) FCS estimates the diffusion dynamics of molecules by recording photon bursting of molecules diffusing through a diffraction-limited focal spot. Fast diffusion gives rise to bursts with shorter temporal widths and vice versa. (E) SMT analysis reveals distinct diffusion dynamics of c-Myc and positive transcription elongation factor (P-TEFb) in live cells. Specifically, c-Myc diffusion is less constrained in space than that of P-TEFb as highlighted by representative single-molecules trajectories (top) and the distribution histograms of the angle formed between the vectors of two consecutive translocation steps (bottom). The data suggest that local protein–protein and protein–DNA interactions alter the diffusion kinetics of P-TEFb molecules. This panel is adapted from Izeddin et al. (2014) with permission. (F) Two-color PALM experiments reveal distinct localization of CTCF (magenta) and the cohesin subunit Rad21 (green) in an interphase cell. Interestingly, CTCF and Rad21 bind to chromatin with different residence times, suggesting their distinct role in establishing chromatin loops in the nucleus. This panel is adapted from Hansen et al. (2017a) with permission. dSTORM, direct STORM.

