Figure 4.
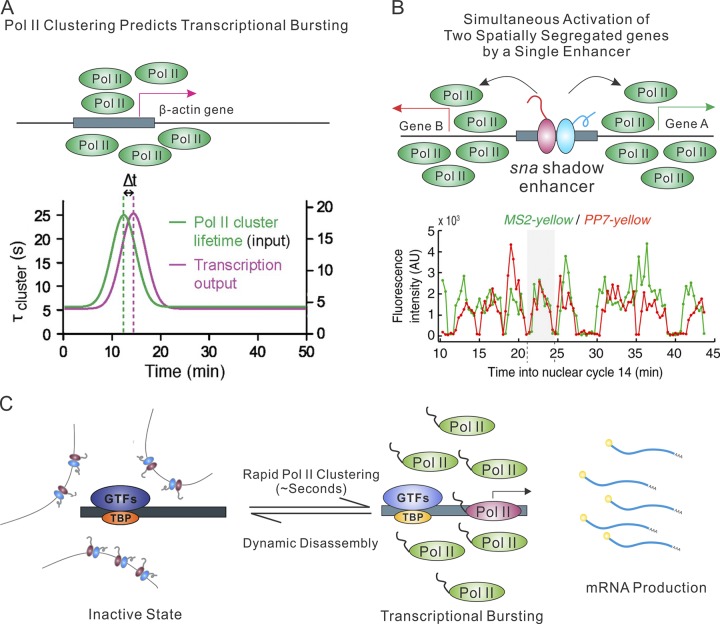
Pol II clustering and enhancer function. (A) Top: Dynamic RNA Pol II clustering proceeds and predicts transcriptional bursting of β-actin gene. Bottom: Pol II cluster lifetime used as model input (green) is overlaid with a plot of the best fit for the mRNA output (magenta) from theoretical model. A time lag (delay Δt) is observed in the model. The bottom panel is adapted from Cho et al. (2016) with permission. (B) Simultaneous activation of two symmetrically localized genes by a single enhancer. Top: Single sna shadow enhancer driving the expression of the symmetric snaPr-MS2-yellow and snaPr-PP7-yellow reporters. Bottom: Transcription activities for the two reporter genes. The intensity of green (MS2-yellow) and red (PP7-yellow) false coloring is proportional to the signal strength for each transcription focus at a given time. The bottom panel is adapted from Fukaya et al. (2016) with permission. (C) Live-cell imaging data suggest that RNA Pol II functions at the core promoter by rapid assembly and disassembly. RNA Pol II clustering predicts RNA production, suggesting that the clustering is likely involved in transcription initiation processes.

