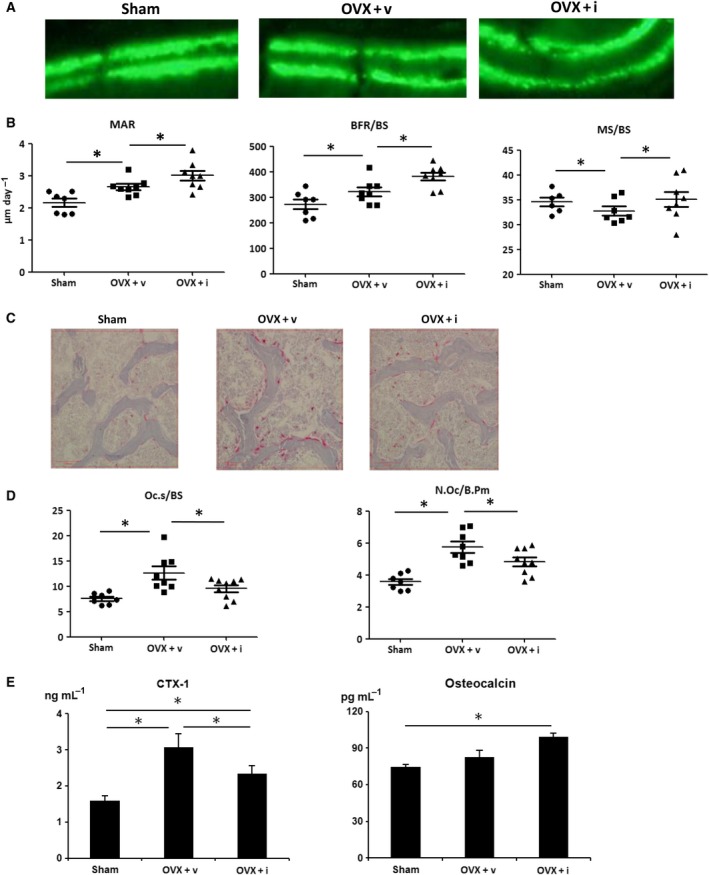
Figure 2.

iPAI‐1 treatment increases bone formation in lumbar vertebrae as assessed by histomorphometric analysis. (A) Fluorescent micrograph of the trabecular bone section showing the calcein (green) labels. (B) MAR, BFR/BS, and MS/BS. (C) Representative images of TRAP‐stained sections from each of the three groups (scale bar, 100 μm) and (D) quantification of TRAP‐stained osteoclast surface relative to the trabecular BS and the number of osteoclasts, expressed relative to the trabecular bone perimeter (N.Oc/B.Pm). (E) Urine CTX‐1 levels. (C) Data represent mean ± SD for eight mice/group. *P < 0.05. OVX + v: OVX + vehicle; OVX + I: OVX + iPAI‐1.
