Figure 1.

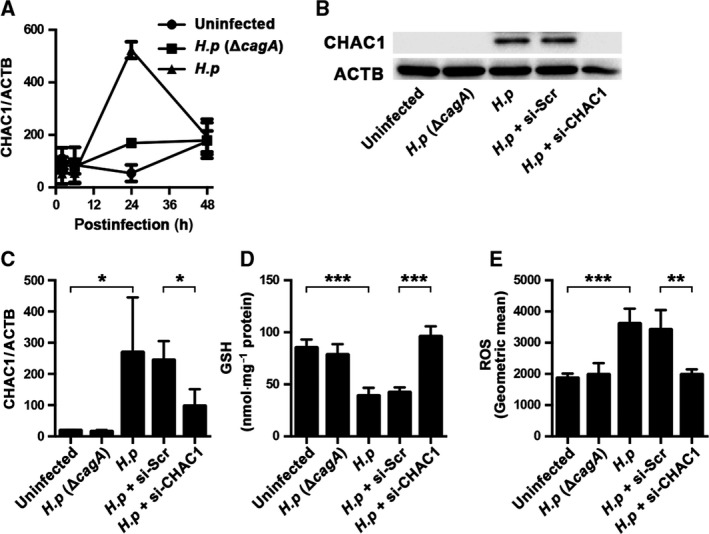
H. pylori infection and CHAC1 expression. (A) CHAC1 mRNA expression normalized with that of β‐actin (ACTB) in AGS cells was measured after cagA‐positive or cagA‐negative H. pylori infection. Total RNA was isolated at 2, 6, 24 and 48 h postinfection. (B–E) Untreated AGS cells were infected by either cagA‐positive or cagA‐negative H. pylori for 24 h. AGS cells transfected with CHAC1 siRNA or scrambled siRNA were also infected by cagA‐positive H. pylori. (B) The protein expression of CHAC1 and ACTB; (C) the mRNA expression of CHAC1 normalized with ACTB; (D) the level of intracellular GSH; (E) the level of intracellular ROS. H.p (ΔcagA) indicates AGS cells infected with cagA‐negative H. pylori; H.p indicates cells infected with cagA‐positive H. pylori; H.p + si‐Scr indicates cells infected with cagA‐positive H. pylori with transfection of scrambled siRNA; H.p + si‐CHAC1 indicates cells infected with cagA‐positive H. pylori with transfection of siRNA CHAC1. Data shown for A and C are the mean ± SE from triplicate measurements derived from three replicate experiments, and data for D and E are the mean ± SE from triplicate measurements derived from four replicate experiments. *P < 0.05, **P < 0.01 and ***P < 0.001.
