
Figure 1.
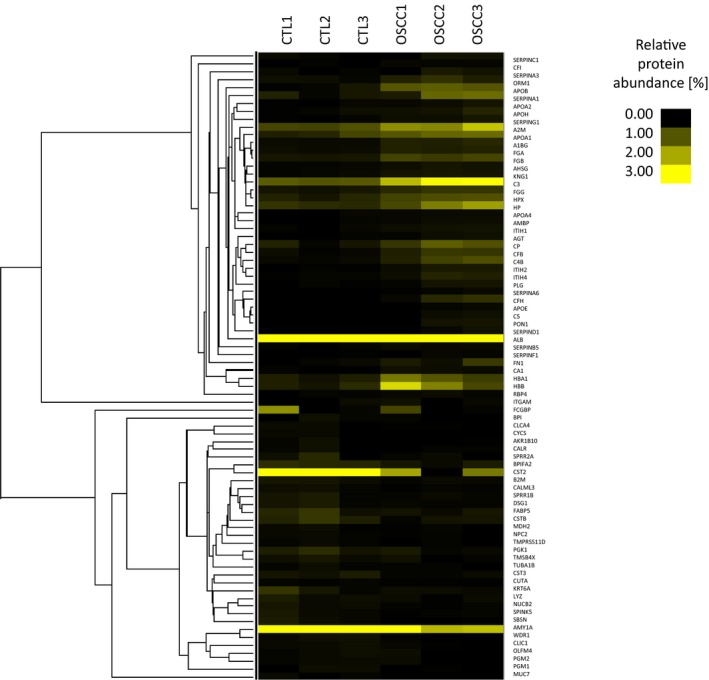
Cluster analysis and heat map of proteins identified in the CTL and OSCC groups. The relative peptide count (%), characteristic of each sample, is shown.
Official websites use .gov
A
.gov website belongs to an official
government organization in the United States.
Secure .gov websites use HTTPS
A lock (
) or https:// means you've safely
connected to the .gov website. Share sensitive
information only on official, secure websites.
Cluster analysis and heat map of proteins identified in the CTL and OSCC groups. The relative peptide count (%), characteristic of each sample, is shown.