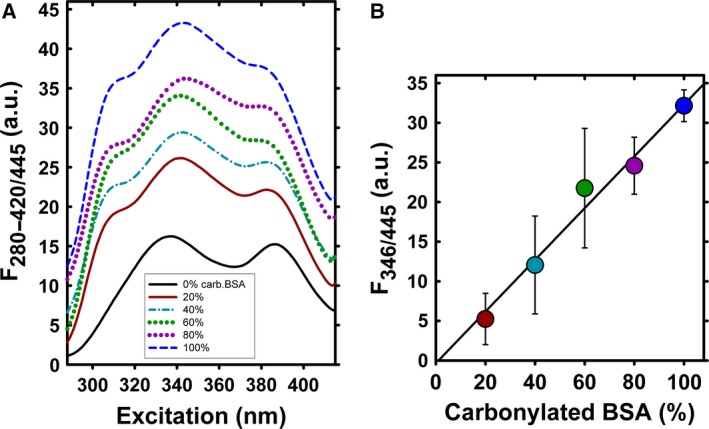
Figure 2.

DNPH derivatization of oxidized BSA. DNPH excitation spectra (A) and corresponding standard curves (B) of oxidized BSA. Samples for standard curves were prepared by mixing borohydride‐reduced and HOCl‐oxidized BSA in varying proportions to maintain a constant protein concentration, as described in the ‘Materials and methods’ section. In (B), the fully reduced BSA has been subtracted from the detected DNPH excitation wavelength values.
