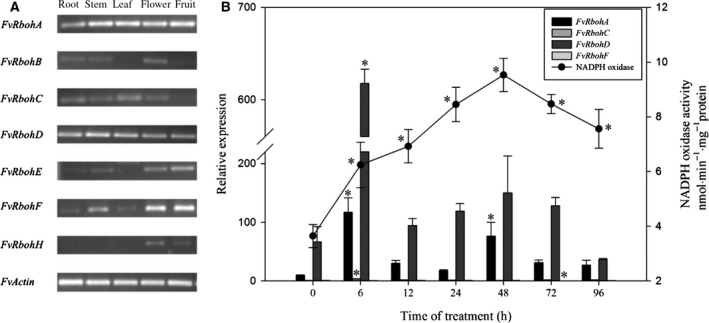
Figure 5.

Expression patterns of FvRbohs in different tissues (A) and response to cold stress (B). The left and right Y‐axis is the scale of the relative transcript abundance level and NADPH oxidase activity, respectively. The X‐axis is the time course of 4 °C cold treatment. Values represent means ± standard error from three biological experiments (n = 3). Asterisks indicate significant differences based on one‐way ANOVA in SPSS 23.0 followed by the Dunnett t‐test (time 0 as the control, P < 0.05).
