
Figure 3.
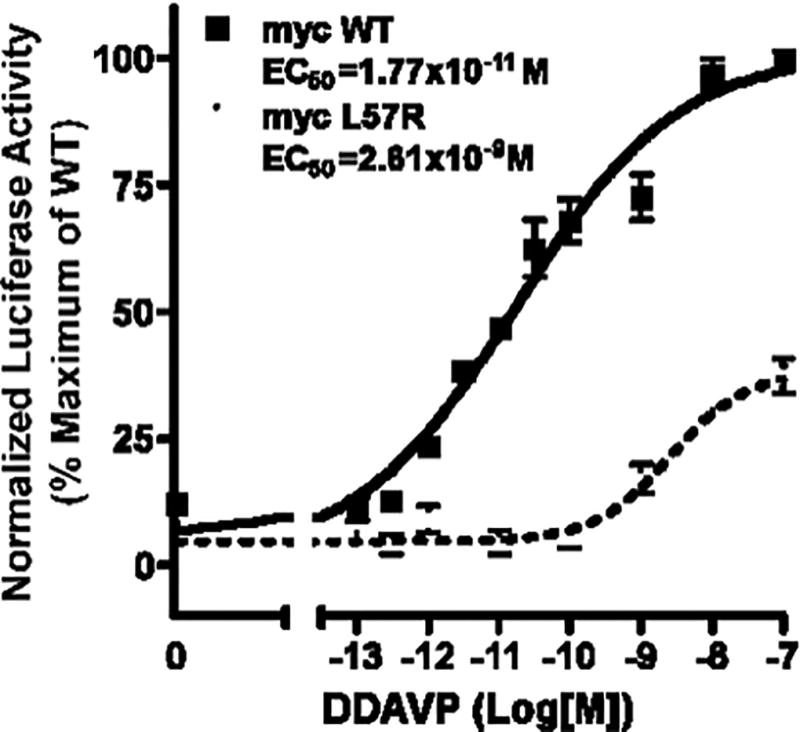
Dose-response curves. Basal (no DDAVP) and stimulated (10−13 to 10−7 M DDAVP) WT V2R and L57R V2R activities expressed as percentage of maximum WT V2R activity are plotted versus log of DDAVP concentration. The EC50 values for WT and mutant are significantly different (P = 0.002). Each point represents the mean +/− SEM of 3 experiments, each performed in triplicate.