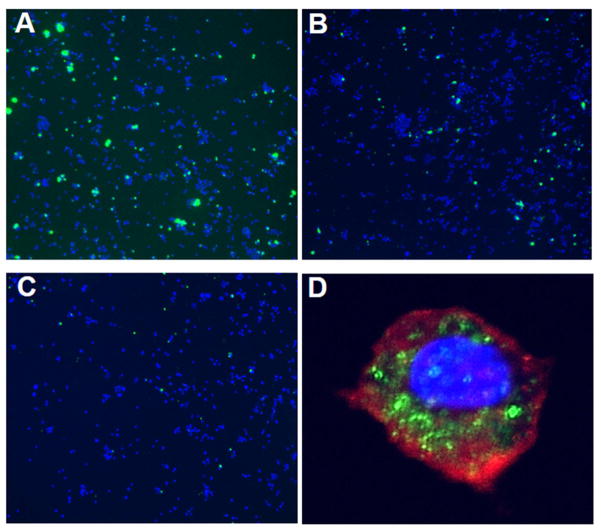
Fig. 5. Macrophage uptake of Aβ and Aβ ICs.
A–C) Representative fluorescence micrographs (10X) of THP-1-derived macrophages (DAPI nuclear counterstain) (blue) after exposure to 1 μM FITC-conjugated Aβ plus 0.1 μM Aβ antibody 4G8 to form Aβ ICs (A) or 1 μM FITC-conjugated Aβ alone (B). Aβ IC and Aβ alone solutions were previously incubated with NHS to permit complement activation. The number of cells co-localized with Aβ (green), as well as their fluorescence intensity, was clearly enhanced by Aβ ICs. Heat inactivation of the serum reduced staining to background (C). D) Representative high power (40X objective) confocal micrograph of a macrophage after exposure to FITC-conjugated Aβ plus 4G8 and NHS. PKH26 (red) was used to stain the cell membrane and DAPI (blue) was used to stain the nucleus. Localization of the FITC label for Aβ (green) was primarily intracellular, suggesting that the macrophages had phagocytosed the Aβ ICs.

