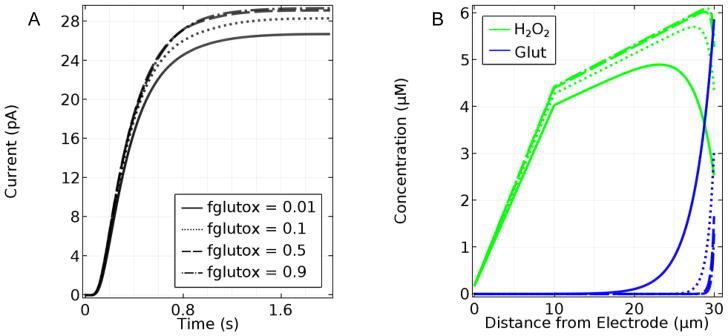
Figure 3.
A. Current response to a 10-μM step change in Glut for sensors with 10-μm-thick Nafion and 20-μm-thick enzyme layers, where the fglutox is varied from 0.01 to 0.9, and the sample O2 concentration equals 270 μM. B. Corresponding plots of SS Glut and H2O2 concentration profiles in the Nafion and enzyme layers. Note that the outer edge of the Nafion layer is at 10 μm and the outer edge of the sensor is at 30 μm.

