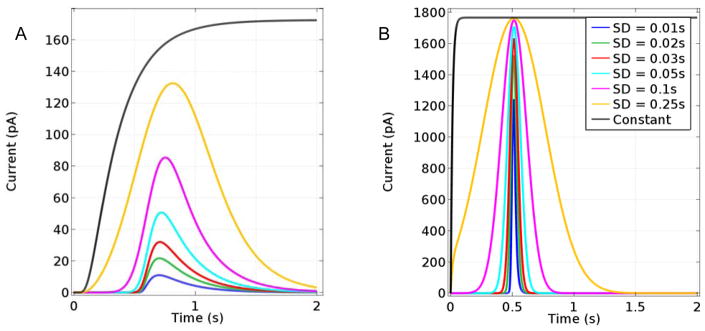
Figure 8.
A. Modeled base-case sensor response to a single pulsed Glut concentration reaching maximum glutamate concentration (Cmax = 10 μM) at 0.5 s and with standard deviations ranging from 0.01–0.25 s and to a step change in bulk sample Glut concentration to 10 μM for reference. B. Responses of a sensor with 1 μm Nafion and 3 μm enzyme layers to the same inputs.

