Figure 1.
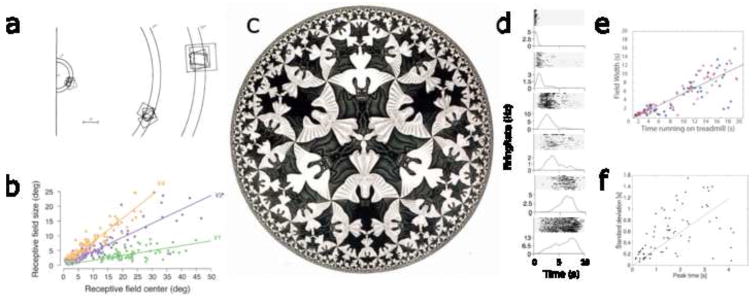
Compressed neural representations of space and time. a. Visual receptive fields of single units from monkey V1. The size of each square indicates the spatial extent of the receptive field; the location of the square shows the preferred excentricity. The clusters of receptive fields were recorded within .1 mm of each other on the cortical surface. Visual receptive fields farther from the fovea average over larger regions of visual space. After [7]. b. Width of spatial receptive fields as a function of position in different regions of macaque visual cortex. After [8]. c. In this tiling by M.C. Escher, the spacing of the angels and devils becomes more compressed as one approaches the edge of the circle. If one samples a constant region of the image, the number of tilings grows larger as one approaches the edge. d. A sequence of hippocampal time cells firing during the 10 s delay interval of a memory task. Each panel gives rasters (top) and smoothed peristimulus time histogram (bottom). Units have consistent receptive fields that tile the delay. Temporal receptive fields later in the delay average over a wider range of time than temporal receptive fields early in the delay. After [9]. e. Width of temporal receptive fields as a function of peak time in rodent hippocampus (blue: CA1; red: CA3). After [10]. f. Width of temporal receptive fields as a function of peak time in rodent mPFC. After [11].

