
Figure 2. Stiffness-sensitive lncRNAs and protein coding genes.
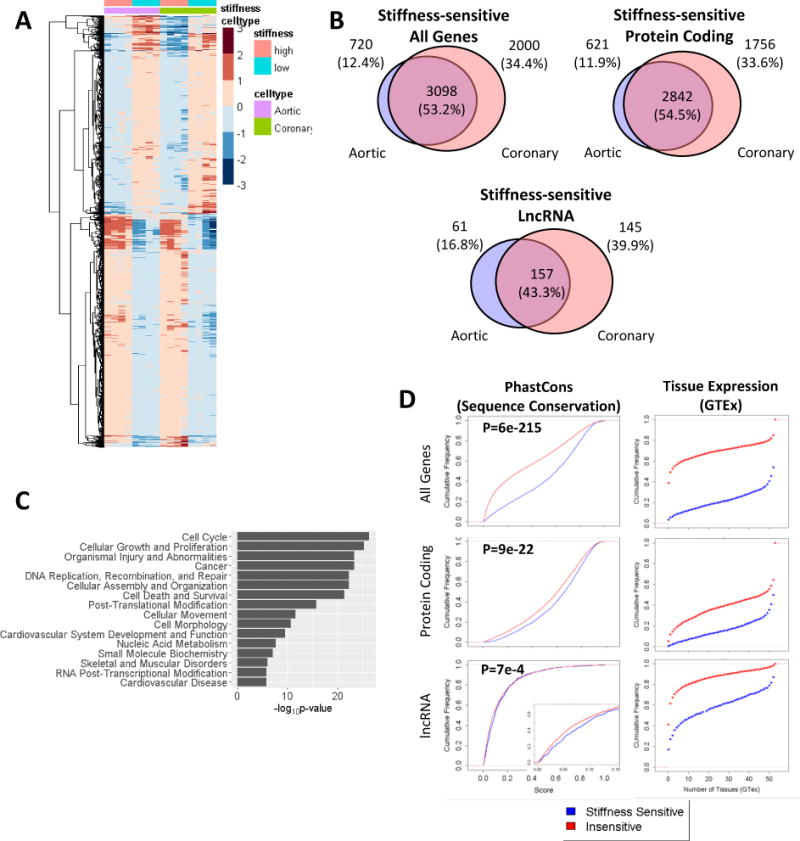
(A) Heatmap of stiffness-sensitive genes (FDR < 0.01) in both Co VSMC and Ao VSMCs. Heatmap colors correspond to log2 (normalized counts). (B) Venn diagrams depicting the overlap in stiffness-sensitive genes in Ao and Co VSMCs. (C) Top pathways enriched in shared stiffness-sensitive genes in Ao and Co VSMCs. (D) Cumulative distributions of conservation (phastCons) scores and tissue expression (GTEx) of stiffness-sensitive v. stiffness-insensitive genes. In-set figure of lncRNA distribution shows zoomed-in distribution at conservation scores 0 to 0.15. A right-shifted cumulative distribution demonstrates higher conservation or expression in more tissues. P-values determined using a Kolmogorov–Smirnov test.