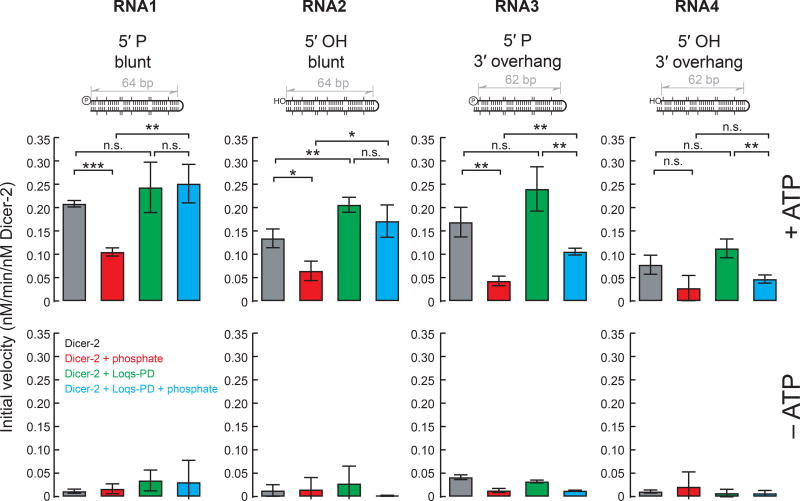
Figure 3. Initial velocities in the in vitro processing assay of hairpin RNAs by Dicer-2 ± Loqs-PD.
Initial velocities determined by the time course assay results shown in Figure 2. Data are mean ± s.d. for three independent trials. P-value <0.05, <0.01, and <0.001 are indicated by *, **, and ***, respectively (Student's t-test).

