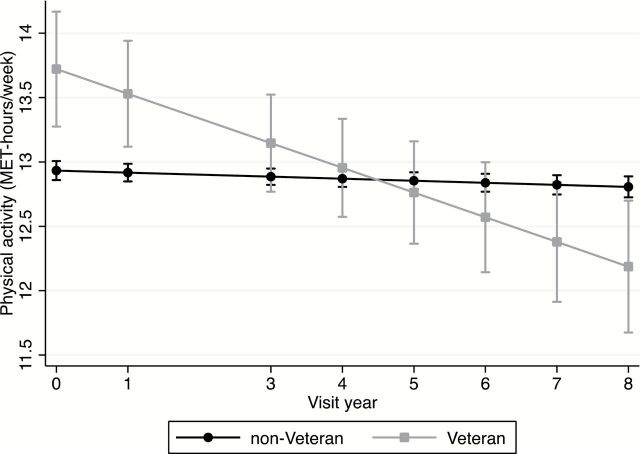
Figure 3.
Trajectories of physical activity (metabolic equivalent-hours/week) among Veteran and non-Veteran women. Models were adjusted for baseline age (continuous), race/ethnicity (non-white/white), education (ordinal), income (ordinal), marital status (nominal), social support (continuous), smoking status (nominal), Healthy Eating Index 2005 (continuous), body mass index (continuous), and study assignment. p Value for interaction <.001.

