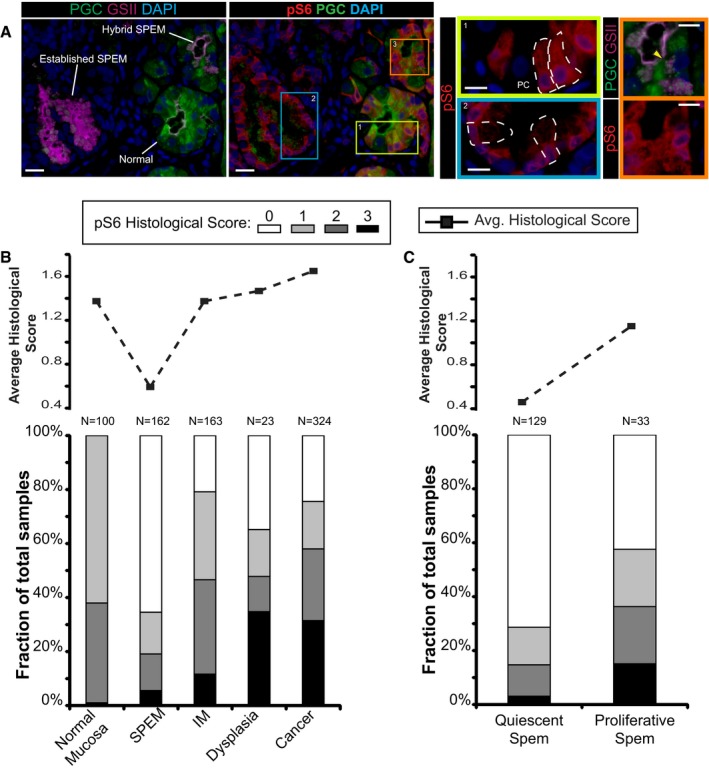
Immunofluorescent images of human gastric tissue from a patient with intestinal‐type gastric adenocarcinoma elsewhere. In this non‐carcinoma containing region of the gastric corpus, various states of metaplasia can be observed that reflect mouse injury models. Extensive previous work (Lennerz
et al,
2010) of a dataset of such resection specimens and of biopsies showing SPEM in a non‐cancer setting has indicated likely stages of progression of SPEM from essentially normal wherein large, pyramidal‐columnar cells at the base express only chief cell markers like pepsinogen C (PGC, green) to “hybrid SPEM” (yellow arrowhead, inset) where smaller, cuboidal columnar cells label with varying degrees of PGC and the neck/SPEM cell marker GSII (purple) to “established SPEM” characterized by cells that label extensively with GSII and have scant PGC; established SPEM cells are mucus‐stuffed, with peripheral, basal, flattened nuclei (blue, DAPI). Higher magnification of each cellular phenotype is shown by color‐coded box on right. As parietal cells are lost in SPEM, the remnant one in the yellow boxed area (labeled “PC”) is consistent with the normal chief cell phenotype (representative individual cells outlined by white dashed lines). Note that there is consistently high expression of pS6 (red) throughout the cytoplasm of such normal chief cells but that this pS6 varies in the hybrid SPEM lesion and is largely scaled down in the established SPEM region (note pS6 only around the nuclei of these cells). Scale bar, 20 μm; pullouts 10 μm.

