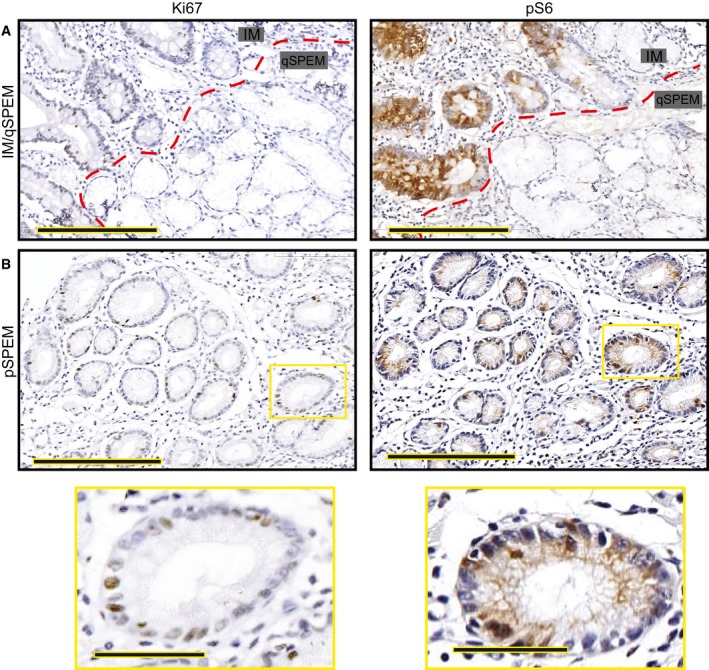
Figure EV5. Representative IHC images from human tissue microarray.

- Intestinal metaplasia (“IM” indicating the glands to upper left of red dashed line) is generally proliferative as evinced by frequent Ki‐67+ cells (left) and is strongly pS6 positive. Most SPEM has a quiescent phenotype (glands labeled on “qSPEM” side of panels) characterized by cells with abundant mucus, flattened basal nuclei, and a lack of both Ki‐67 and pS6 staining Scale bar, 200 μm.
- Rare SPEM lesions show cells with cuboidal columnar morphology. These lesions show Ki‐67 positivity usually associated with pS6 positivity. Boxed regions are shown at higher magnification below. Scale bar, 200 μm; pullout, 50 μm.
