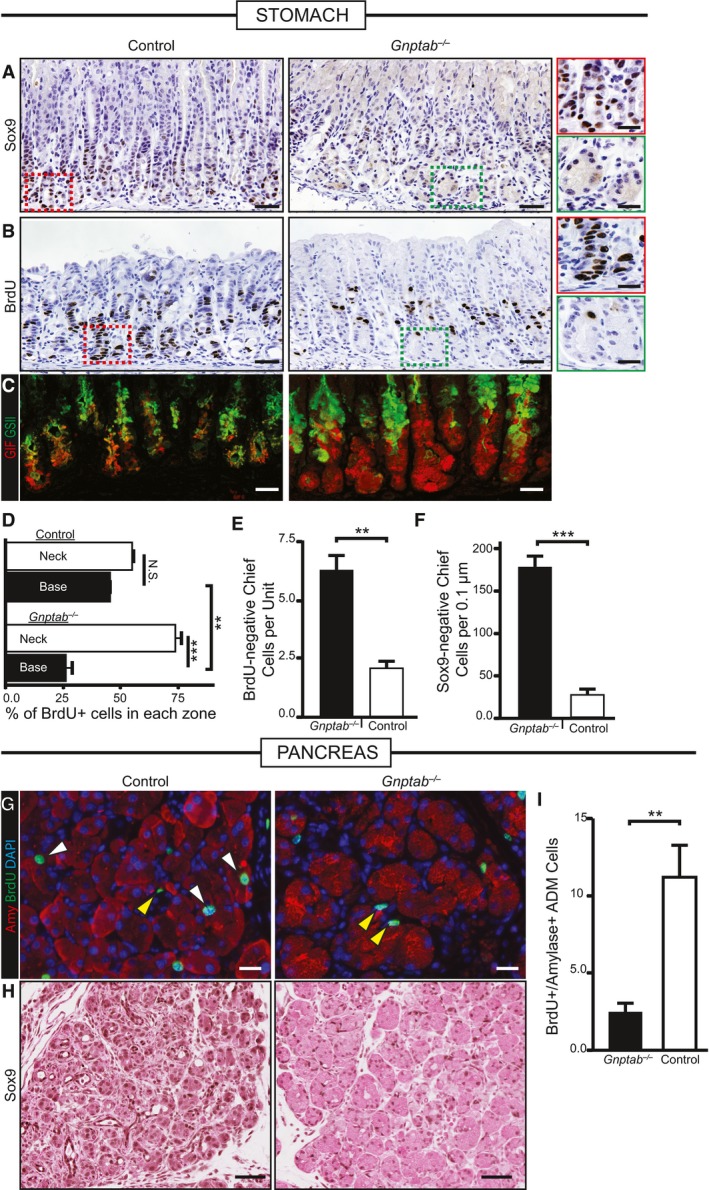
Immunohistochemical analysis of SOX9 expression at peak SPEM stages following gastric injury. In control and Gnptab
−/+ mice, SOX9 becomes expressed in reprogramming chief cells in the bases of the corpus at SPEM stages, but not in Gnptab
−/− mice. Color‐coded boxes shown at higher magnification shown at right for panels (A and B). Scale bar, 50 μm; 25 μm pullout.
S‐phase, cell cycle marker BrdU is incorporated throughout the gastric corpus unit at peak SPEM stages in control WT or Gnptab
−/+ mice. In Gnptab
−/− mice, the gastric unit bases, where proliferation is recruited from chief cells, show a marked relative deficit in BrdU+ cells. Scale bar, 50 μm; 25 μm pullout.
Immunofluorescence analysis of injured gastric tissue from Gnptab
−/− and control mice. GIF/GSII co‐expression is the hallmark of SPEM. In control mice, the vast majority of corpus unit bases are converted to GIF/GSII co‐expression state. In Gnptab
−/− mice, bases are resistant to conversion and remain as GIF single positive cells. Red, GIF; green, GSII. Scale bar, 20 μm.
Quantification of randomly sampled 20× fields stained with BrdU. Distribution of BrdU in neck region vs. base region (note total = 100%) is plotted. Note control mice have equivalent amounts of BrdU‐labeled cells in the neck and base (˜50% in each), whereas Gnptab
−/− mice BrdU‐labeled cells substantially shifted away from the paligenotic base of units and into the isthmal‐neck region, where the constitutive stem cell is active.
Quantification of randomly sampled 20× fields stained with BrdU in control and Gnptab
−/− mice. Gnptab
−/− mice have significantly more BrdU‐negative base cells compared to control animals.
Quantification of control and Gnptab
−/− corpus units stained for SOX9 scored for the amount of SOX9‐negative chief cells per unit at peak SPEM stages. Gnptab
−/− mice have significantly more SOX9‐negative bases compared to control animals.
Representative immunofluorescence images of injured control and Gnptab
−/− pancreatic tissue at cerulein 5 days. Red, amylase; green, BrdU; blue, DAPI. White arrows show proliferating, amylase+ acinar‐derived cells (note these are not seen in Gnptab
−/− mice). Yellow arrowheads show proliferating stromal cells that are not affected by loss of GNPTAB. Scale bar, 20 μm.
Representative immunohistochemistry of SOX9 stained control and Gnptab
−/− pancreatic tissue at cerulein 5 days. Gnptab
−/− tissue has reduced metaplastic phenotype and reduced expression of SOX9. Scale bar, 50 μm.
Quantification of amylase+BrdU+ cells of control and Gnptab
−/− tissue in randomly sampled 20× fields at 5 days of cerulein injury.
‐test with unequal variance; data represented as mean ± SEM of the means from 10 low‐power fields each from 3 independent experiments.

