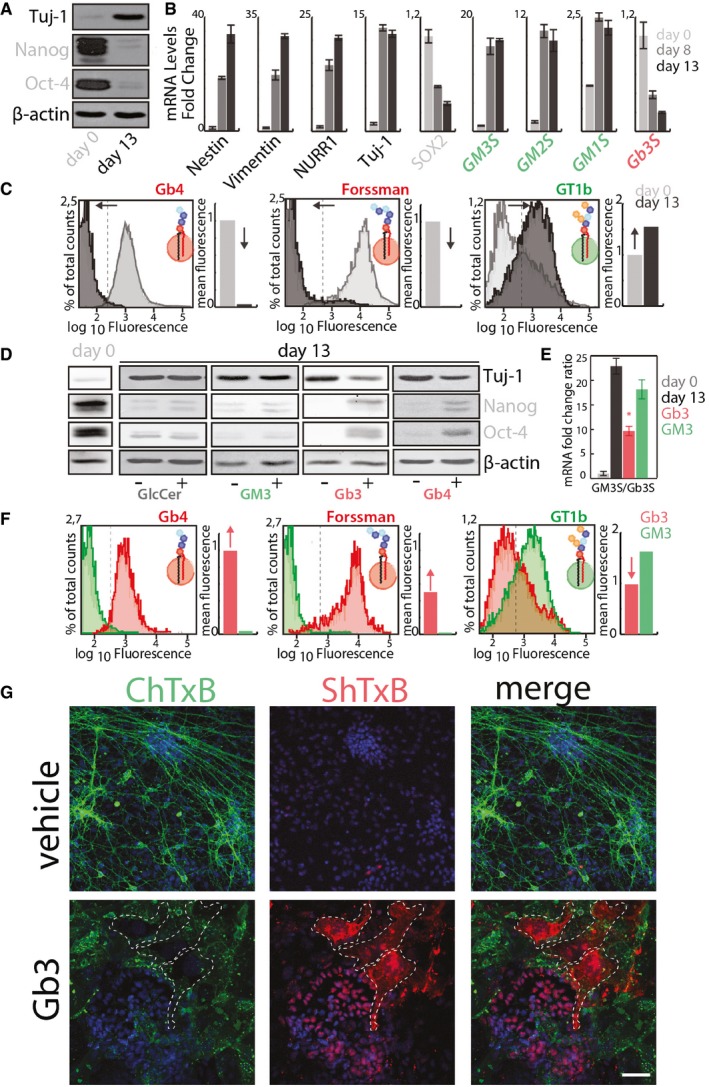
E14‐mESCs in an undifferentiated state (day 0) or induced to differentiate into neurons for 13 days were processed for Western blotting to evaluate the expression of neural (i.e. Tuj‐1) and stemness (i.e. Nanog, and Oct4) markers.
The mRNA levels of neuronal markers (black); stemness markers (grey); ganglio‐series synthesising enzymes (green); globo‐series GSL‐synthesising enzymes (red) were evaluated in cells treated as in (A). Data are means ± SD of at least three independent experiments.
E14‐mESCs treated as in (A) were analysed by cytofluorometry with antibodies directed against globo‐series GSLs (i.e. Gb4 and Forssman) or the ganglioside GT1b. Cytofluorimetric profiles and normalised mean fluorescence are shown for each antibody at day 0 (grey) and at day 13 (black). Arrows indicate the direction of changes observed during neural differentiation.
E14‐mESCs were induced to differentiate into neurons over 13 days in presence of the indicated GSLs (25 μM) or vehicle (methanol). Subsequently, cells were processed for Western blotting as in (A).
E14‐mESCs treated as in (D) were processed for RNA extraction. The mRNA levels for Gb3S and GM3S were evaluated by qPCR. GM3S/Gb3S mRNA ratios are shown. Day 0 (grey); day 13 + vehicle (black); day 13 + Gb3 (red); day 13 + GM3 (green). Data are means ± SD of at least three independent experiments. *P ≤ 0.05.
E14‐mESCs treated as in (E) were analysed by cytofluorometry after 13 days of differentiation with antibodies directed against globo‐series GSLs (i.e. Gb4 and Forssman) or the ganglioside GT1b. Cytofluorimetric profiles and normalised mean fluorescence are shown for each antibody for cells treated with Gb3 (red) or GM3 (green). Red arrows indicate changes induced by Gb3 treatment.
E14‐mESCs treated with Gb3 or vehicle were stained with ChTxB‐Alexa488 (green), ShTxB‐Cy3 (red), and DAPI (blue). Dashed lines indicate ShTxB‐positive cell perimeters. Scale bar, 50 μm.

