
Figure 3. GSL production in non‐neural cells at the single‐cell level.
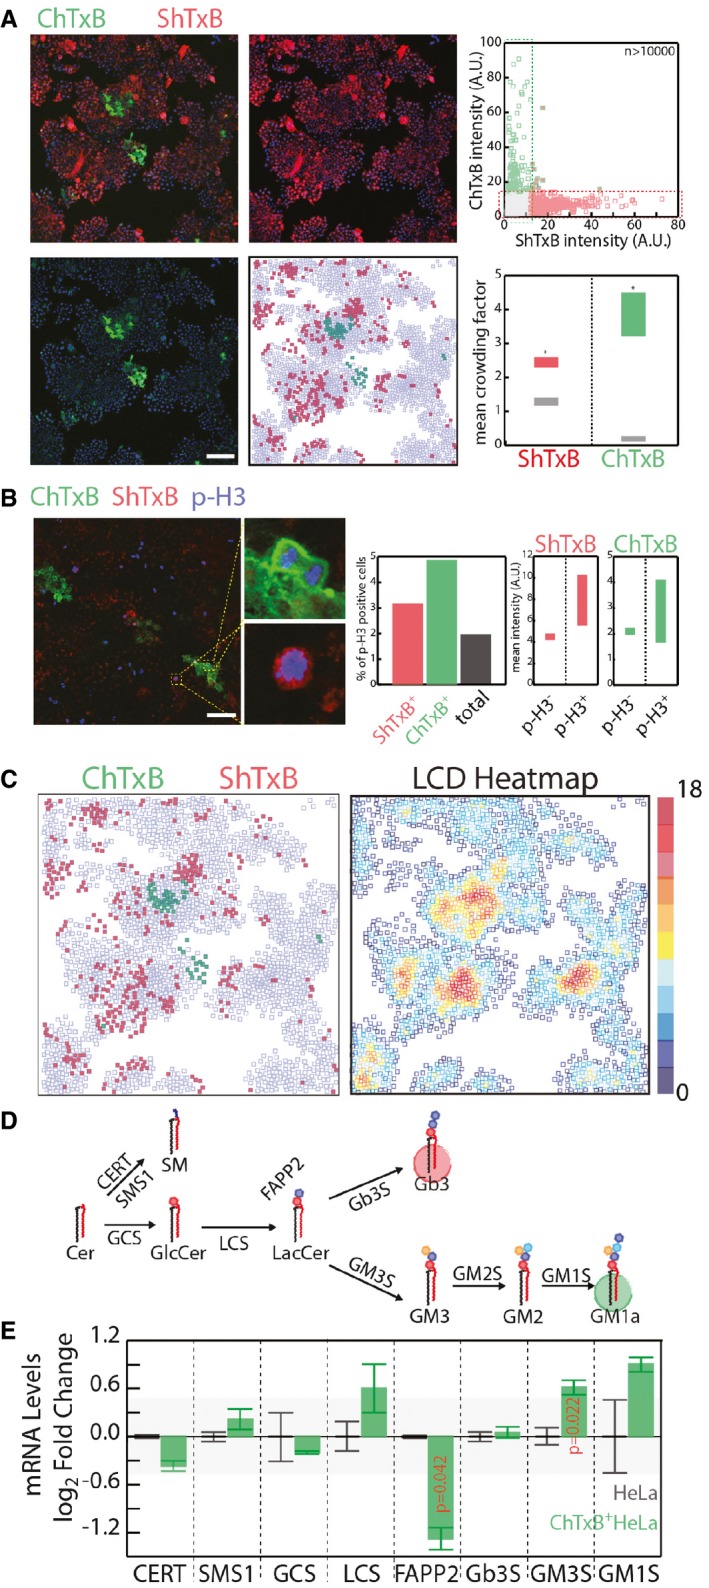
- HeLa cells were fixed and stained with ChTxB‐Alexa488 (green), ShTxB‐Cy3 (red), and DAPI (blue). Acquired confocal images were segmented by CellProfiler software (Shannon et al, 2003), as detailed in the Appendix. Mean ChTxB‐ and ShTxB‐associated fluorescence intensity was calculated for each cell. Cells with ChTxB or ShTxB fluorescence intensity ≥ 15% maximal recorded fluorescence intensity were considered ChTxB‐positive (green squares), ShTxB‐positive (red squares), or double‐positive (green‐edged red squares), with double‐negative cells represented by empty squares (central‐low panel). Scale bar, 100 μm. Upper right: ChTxB versus ShTxB fluorescence mean intensity for 10,767 individual cells as a scatter plot. Bottom right: as a measure of the degree of clustering of ChTxB (or ShTxB)‐positive cells, the colony factor (defined in Appendix Methods) was calculated for 272 ChTxB‐positive and 2,334 ShTxB‐positive cells. The mean crowding factors ± 3 × SEM for ChTxB‐positive cells (green rectangle) and ShTxB‐positive cells (red rectangle) are indicated. The experimentally obtained colony factors were then compared with the randomly expected colony factors, as defined in Appendix Methods (lower right panel, grey rectangles). *P ≤ 0.05.
- Left panels: HeLa cells were fixed and subsequently stained with ChTxB‐Alexa488 (green), ShTxB‐Cy3 (red), anti‐phospho‐Ser10 histone‐H3 (pH3) as a marker of G2/M phase cells (blue) and DAPI (not shown). Insets show examples of pH3+/ChTxB+ and pH3+/ShTxB+ cells, which indicate that both ChTxB positivity and ShTxB positivity are compatible with G2/M phase cells. Acquired confocal images were segmented using the CellProfiler software (Shannon et al, 2003). Middle panel: mean pH3‐, ChTxB‐, and ShTxB‐associated fluorescence intensities were calculated for 4,051 cells. Individual cells showing an associated ChTxB or ShTxB fluorescence intensity ≥20% (pH3) and ≥15% (ShTxB, ChTxB) maximal recorded fluorescence intensity were considered pH3‐, ChTxB‐, and ShTxB‐positive. The percentages of pH3+ cells in the total population (black column) and in the ShTxB+ (red) and ChTxB+ (green) populations are reported. Right panels: the ChTxB and ShTxB associated mean intensities in the pH3+ and pH3− cell subpopulations. Scale bar, 100 μm.
- The image dataset obtained in (A) was used to correlate ChTxB and ShTxB staining with local cell density (LCD; defined as the number of cells within a 50 × 50‐pixel [69.19 × 69.19 μm] square drown around each cell) for each individual cell imaged. ChTxB‐ and ShTxB‐positive cell distribution obtained from a representative image (left) and the LCD heatmap (right) obtained for the same image.
- Schematic representation of the GSL synthetic pathway in HeLa cells. GCS, GlcCer synthase; LCS, LacCer synthase; Gb3S, Gb3 synthase; GM3S, GM3 synthase; SMS1, sphingomyelin synthase 1; CERT, ceramide transfer protein; FAPP2, four phosphate adaptor protein 2.
- Transcriptional profile of GSEs and accessory factors (i.e. CERT, FAPP2) in ChTxB+ HeLa cells (isolated as reported in the Appendix), evaluated by qPCR. mRNA levels are expressed as log2‐fold changes ± SD with respect to unsorted HeLa cells. The background shaded area delimits values ranging from −0.5 to 0.5 log2 fold change. Data are means ± SD from at least three independent experiments.