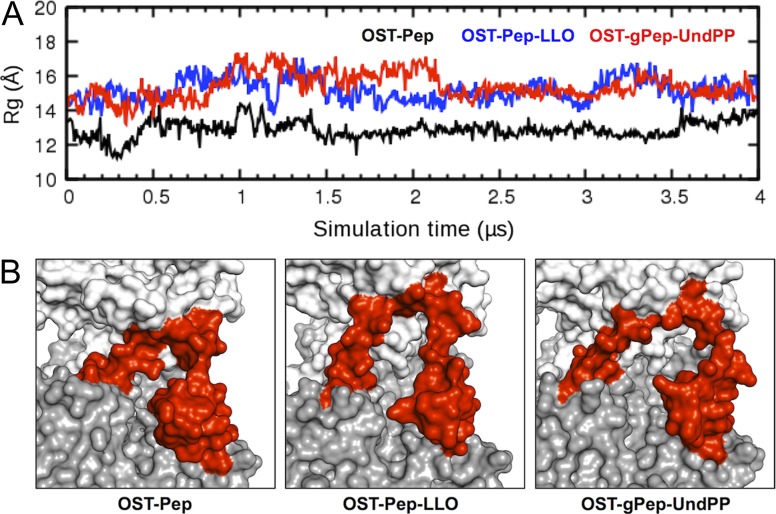
Fig. 5.
Conformational changes of EL5. (A) Radius of gyration (Rg) time-series of EL5 in OST-Pep (black), OST-Pep-LLO (blue), and OST-gPep-UndPP (red). The Rg was calculated using the Cα atoms of EL5. (B) The last snapshot of each system is shown in surface representation. The transmembrane domain (residues 2−432), periplasmic domain (433−712), and EL5 (282−323) are colored gray, white, and red, respectively. This figure is available in black and white in print and in color at Glycobiology online.

