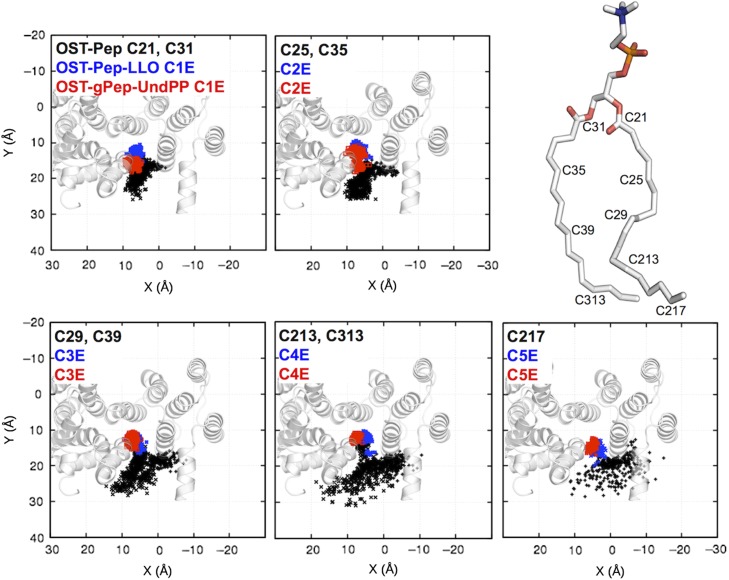
Fig. 9.
Distributions of the XY locations of a few selected carbon atoms in a POPC in OST-Pep (black) and in undecaprenyl moieties in OST-Pep-LLO (blue) and OST-gPep-UndPP (red). Each figure contains carbon atoms that are in equivalent Z-positions in both POPC and undecaprenyl tails. The TM domain in cartoon representation is incorporated into each figure with the same orientation as in Figure 7A. See Supplementary data, Figure S9 for the XY locations of isoprenoid units 6–11. This figure is available in black and white in print and in color at Glycobiology online.

