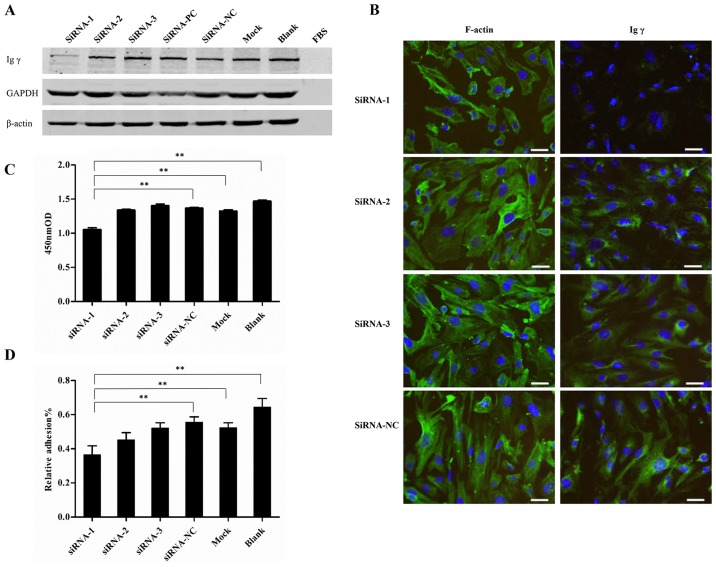
Figure 5.
IgG expression 48 h post-transfection with siRNA. (A) Western blot analysis confirmed successful knockdown of IgG in podocytes by siRNAs. GAPDH was used as a positive control. (B) Immunofluorescence assay of F-actin and Igγ staining. F-actin and IgG were immunostained (green), and nuclei were stained with DAPI (blue).(C) CCK-8 analysis of cell viability. (D) CCK-8 analysis of the adhesive ability of podocytes. siRNA-1, siRNA-2 and siRNA-3, siRNAs targeted the Igγ constant region; siRNA-PC, siRNA targeted GAPDH; siRNA-NC, scrambled siRNA; mock, cells treated with only Lipofectamine 3000; blank, untreated cells; FBS, culture medium without cells. Scale bar, 50 µm. Data are presented as the means ± standard deviation, n=3. **P<0.01. CCK-8, Cell Counting kit-8; FBS, fetal bovine serum; Ig, immunoglobulin; Igγ, IgG heavy chain; NC, negative control; OD, optical density; PC, positive control.

