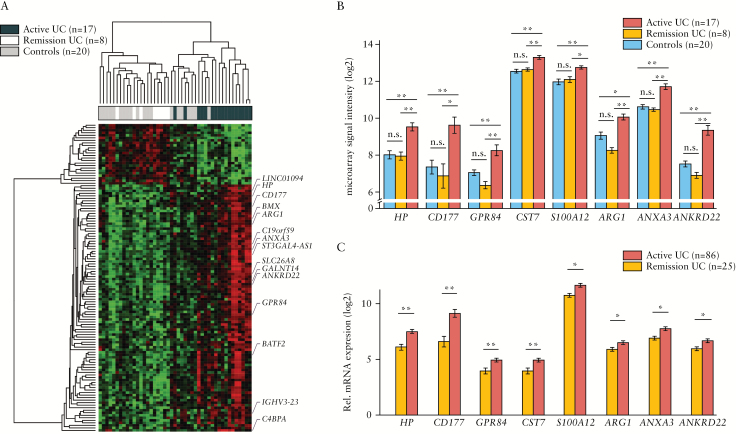
Figure 1.
Whole-blood transcriptional profile associated with the presence of endoscopic mucosal lesions in UC. [A] Heatmap representation of differentially expressed genes in peripheral blood from UC and non-IBD controls according to microarray analysis [Table 1, Group 1]. A total of 122 differentially expressed genes in active UC patients [endoscopic Mayo score ≥ 1] compared with non-IBD controls and UC patients in remission [endoscopic Mayo score = 0] are represented and the 15 genes with a fold-change above 2 are highlighted. Up-regulated genes are shown in red and down-regulated genes are shown in green. Each row shows one individual gene and each column an experimental sample. Unsupervised hierarchical cluster method using Pearson distance and average linkage method was applied for gene and sample classification. Samples from non-IBD controls [shown in skyblue, n = 20], remission UC patients [shown in gold, n = 8], and active UC patients [shown in indianred, n = 18] are shown. [B] Bar plot representation [mean ± MSE] of microarray data for the eight genes that have been validated by RT-PCR [Table 1, Group 1]. Samples from non-IBD controls [shown in skyblue, n = 20], remission UC patients [shown in gold, n = 8], and active UC patients [shown in indianred, n = 18] are shown. [C] Bar plot representations [mean ± MSE] of the eight genes validated by RT-PCR in peripheral blood from UC patients [Table 1, Group 2]. Samples from remission UC patients [shown in gold, n = 25] and active UC patients [shown in indianred, n = 86] are shown; *P < 0.05, **P < 0.01 by pairwise Wilcoxon test. UC, ulcerative colitis; IBD, inflammatory bowel disease; MSE, mean squared error; RT-PCR, real-time polymerase chain reaction.

