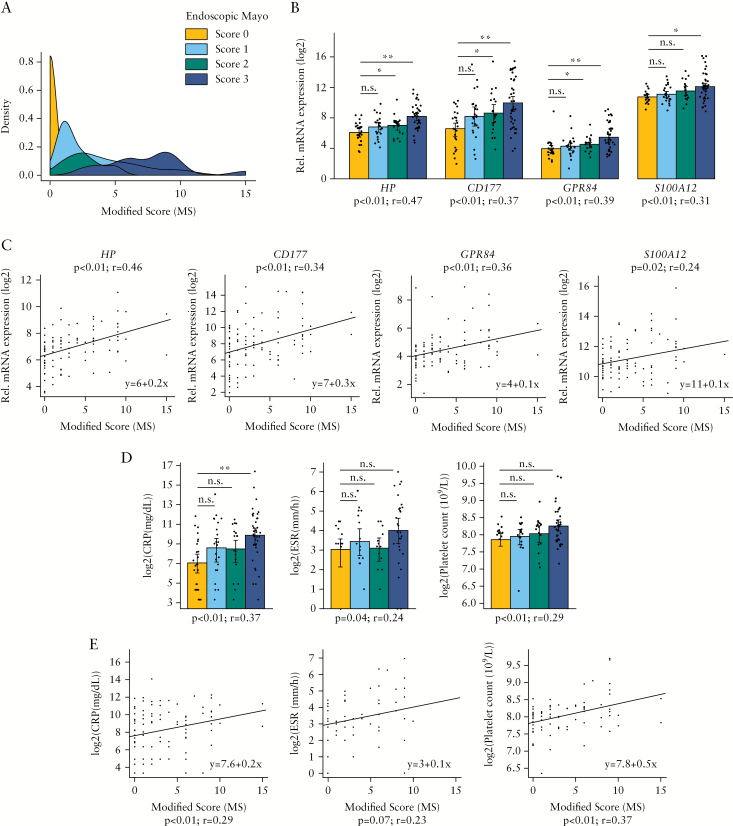
Figure 2.
Association between blood transcripts and serological biomarkers with the degree of endoscopic inflammation. [A] Representations of probability density function of Modified Score [MS] for each endoscopic Mayo score. Density function of UC patients from Group 2 [Table 1] with endoscopic Mayo score equals 0 [n = 25, shown in gold], patients with endoscopic Mayo score = 1 [n = 22; shown in skyblue], patients with endoscopic Mayo score = 2 [n = 19; shown in seagreen], and patients with endoscopic Mayo score = 3 [n = 29; shown in darkblue] are shown. [B] Bar plot representation [mean ± MSE] of HP, CD177, GPR84, and S100A12 gene expression from RT-PCR analysis. Patients are categorised by endoscopic Mayo score; patients with endoscopic Mayo score = 0 [n = 25, shown in gold], patients with endoscopic Mayo score = 1 [n = 24; shown in skyblue], patients with endoscopic Mayo score = 2 [n = 21; shown in seagreen], and patients with endoscopic Mayo score = 3 [n = 41] shown in darkblue] are shown. Additionally, the data point of each observation is represented in the plot; *p < 0.05, **p < 0.01 by pairwise Wilcoxon test. The Spearman’s rho and p-value are also shown. [C] Correlation between MS and gene expression of HP, CD177, GPR84, and S100A12 [RT-PCR data]. The linear regression model and Spearman’s rho and p-value are shown. [D] Bar plot representation [mean ± MSE] of CRP, ESR, and platelet count by endoscopic Mayo score [same observations as panel B]; *p < 0.05, **p < 0.01 by pairwise Wilcoxon test. The Spearman’s rho and p-value are also shown. [E] Correlation between MS and CRP, ESR, and platelet count [same observations as panel C]. The linear regression model and Spearman’s rho and p-value are shown. UC, ulcerative colitis; MSE, mean squared error; RT-PCR, real-time polymerase chain reaction; CRP, C-reactive protein; ESR, erythrocyte sedimentation rate.

