Figure 4.
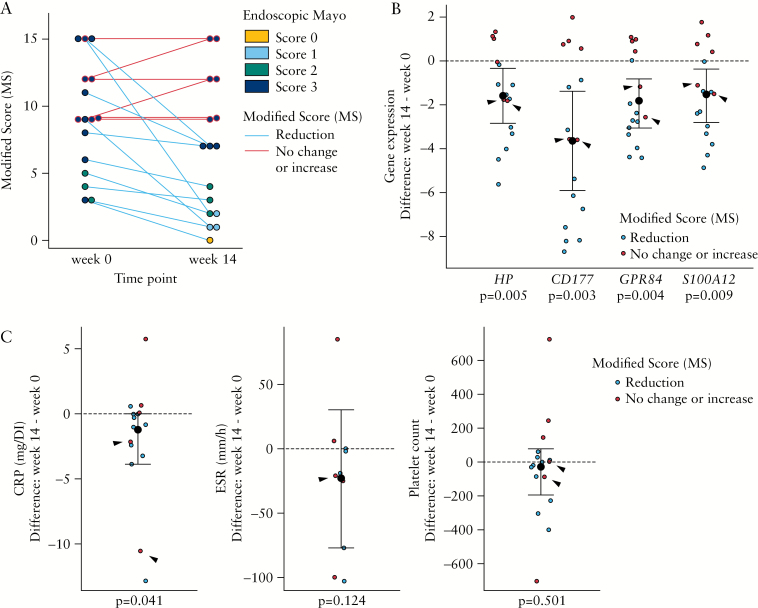
Changes in whole-blood transcriptional profiles are associated with endoscopic progression in UC patients after 14 weeks of anti-TNFα treatment. [A] Distribution of MS in patients with UC before and after anti-TNFα treatment [n = 16, Table 2]. Each dot represents an individual patient at Week 0 or 14. Dot colour corresponds to endoscopic Mayo score and the colour of the connecting line to the endoscopic progression [assessed by MS]. Blue connecting line corresponds to mucosal improvement [n = 10] and red connecting line to no improvement or worsening [n = 6]. [B] Dot plot representation of HP, CD177, GPR84, and S100A12 gene expression changes after 14 weeks of anti-TNFα treatment. Y-axis shows the difference between gene expression at Weeks 14 and 0. [C] Dot plot representation of CRP, ESR, platelet count, and serological HP changes after 14 weeks of anti-TNFα treatment. Y-axis shows the difference between biomarker levels at Weeks 14 and 0. Black dashed line at point 0 denotes no changes in gene expression. Based on MS, individuals with mucosal improvement [shown in blue, n = 10] and those without improvement or worsening [shown in red, n = 6] are shown. Black arrows show two samples without mucosal improvement [based on MS], but decreased gene expression after treatment. Median ± IQR are represented. UC, ulcerative colitis; MS, Modified Score; CRP, C-reactive protein; ESR, erythrocyte sedimentation rate; TNF, tumour necrosis factor; IQR, interquartile range.

