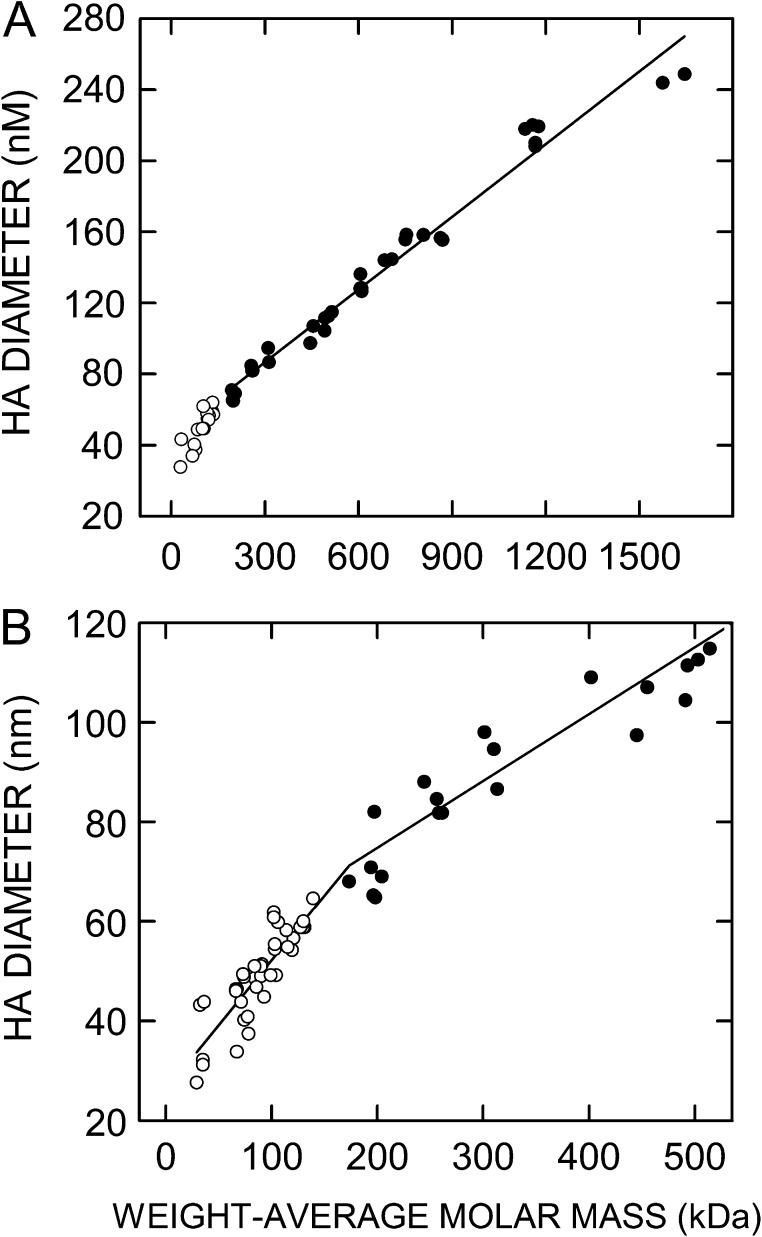
Fig. 2.
SEC-MALS assessment of the relationship between weight-average molar mass and particle size for very-narrow size range HA. Samples of Select-HA and other very-narrow size range HA were analyzed by SEC-MALS as described in Methods to determine weight-average molar mass and particle diameter. Values below or above 200 kDa are white or black circles, respectively. (A) The full scale range of Mw values examined is shown with a linear regression line (r2 = 0.98) using all data ≥200 kDa. (B) The scale in A is expanded to highlight the region below ~500 kDa. The regression line for samples >200 kDa is the same as in panel A and a different regression line (r2 = 0.75) is shown for samples <200 kDa. The intersection of the two regression lines indicates that the midpoint of the transition in the relationship between HA size and mass occurs at about 200 kDa. The change in HA conformation from an extended rod-like structure to a more compact random coil likely occurs in stages over an extended mass range (e.g., 100–300 kDa) around this approximate midpoint.

