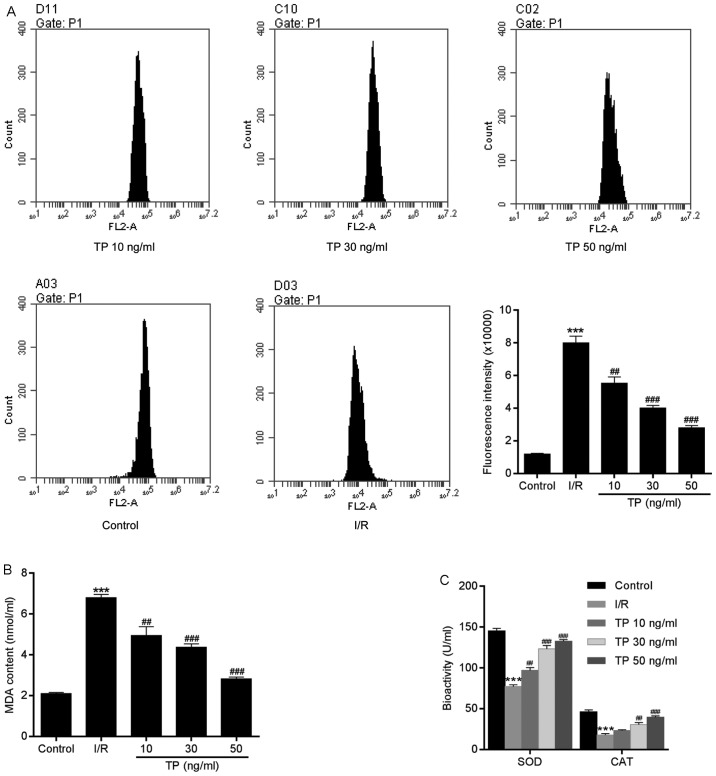
Figure 7.
Generation of ROS in H9C2 cells during the process of cell apoptosis. (A) Compared with in the control group, ROS, as measured using dihydroethidium, was significantly decreased in TP-treated cells in a dose-dependent manner. (B and C) TP exerted protective effects against I/R via SOD, MDA and CAT. ***P<0.001, compared with the control group. ##P<0.01, ###P<0.001, compared with the I/R group (n=3). CAT, catalase; I/R, ischemia/reperfusion; MDA, malondialdehyde; ROS, reactive oxygen species; SOD, superoxide dismutase; TP, triptolide.

