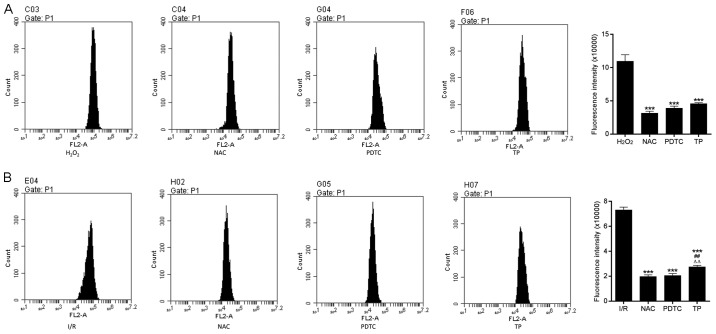
Figure 8.
ROS generation in H9C2 cells during the process of cell apoptosis. (A) ROS generation was measured in H9C2 cells treated with H2O2 for 24 h. ***P<0.001, compared with the H2O2 group. (B) ROS generation in H9C2 cells after 2 h of ischemia and 6 h of reperfusion. ***P<0.001, compared with the I/R group. ##P<0.01, compared with the NAC group. △△P<0.01, compared with the PDTC group (n=3). H2O2, hydrogen peroxide; I/R, ischemia/reperfusion; NAC, N-acetylcysteine; PDTC, pyrrolidine dithiocarbamate ROS, reactive oxygen species; TP, triptolide.

