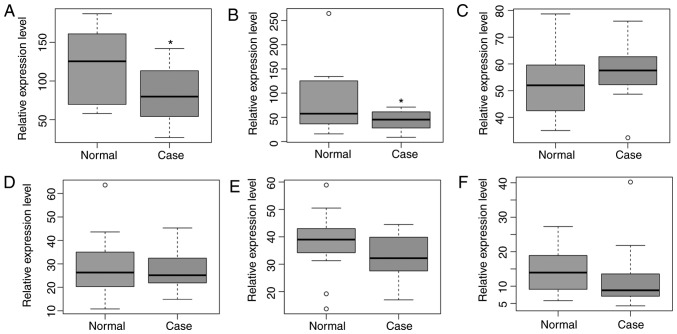
Figure 5.
Validation of selected DElncRNAs in GSE7158. The x-axes show PMOP (case) and normal control groups, and the y-axes show relative expression levels. Student's t-test was used to calculate the significant differences in DElncRNAs between the PMOP and normal control groups. (A) PSMD5-AS1; (B) PAX8-AS1; (C) JHDM1D-AS1; (D) LINC00963; (E) LOC100506113; (F) HCG27. *P<0.05. DE, differentially expressed; lncRNAs, long non-coding RNAs; PMOP, post-menopausal osteoporosis.

